The energy data reported in the table is generated from this method using hourly temperature and humidity readings furnished by the National Weather Service (NWS). It can be applied in practical situations to quickly and accurately analyze operational costs of hvac systems that are directly influenced by the weather. The following is a very brief summary of the energy data provided in the table. More detail with examples on how the data can be applied will follow in upcoming issues. Outside air ventilation heating and cooling. This data represents the total (sensible plus latent) cooling energy in ton-hrs/cfm of outside air and the sensible heating energy in therms/cfm required to maintain a constant 55?F.
Humidification water consumption. This is the water consumption in gal/cfm of outside air required to maintain 30% rh at 70? space temperature. The data can be used to calculate water consumption and humidification energy costs.
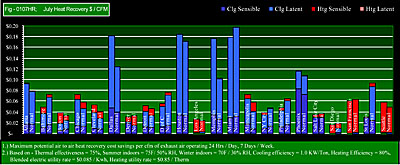
Air-to-air heat recovery. This data represents the maximum potential heat recovery associated with equipment that transfers heat energy between outdoor air ventilation and exhaust air streams based on a thermal effectiveness of 75%. Data is provided for both sensible and total heat recovery systems.
Economizer hours. The number of hours that economizer "free cooling" systems can provide 100% of any required off-season cooling. The airside economizer hours are the total number of hours when the outside air, dry bulb temperature is less than 55?. The waterside economizer hours are the total number of hours when the outside air, wet bulb temperature is less than 40?. The data is useful in evaluating the feasibility of new economizer systems or performance of existing systems.
Comparisons are made to normal data derived from the TMY-2 hourly data set (1961 through 1990) compiled by the National Renewable Energy Laboratory (NREL) for the United States Department Of Energy (DOE)2. Additionally, normal data is generated using the 2001 calendar so that the number of weekdays are equivalent to the actual number of weekdays in the data month.
Figures 0107V and 0107HR track the ventilation cost and potential heat recovery cost savings on a monthly basis. The sensible and latent components are shown in a stacked column to show the contribution of each value to the total. An "apples-to-apples" comparison is made to normal values generated using the same heating and cooling efficiencies and blended utility rates.
In addition to the above energy-related data, the table includes degree days, maximum and minimum dry bulb temperature, wet bulb temperature, humidity ratio, and enthalpy compared to normal conditions from the historical record provided by the National Climatic Data Center (NCDC)3. The number of hours that meet or exceed ASHRAE design conditions (0.4% for cooling and wet bulb and 99% for heating) are also provided to evaluate how the year is measuring up to design conditions.
The purpose of this column is to provide hvac engineers and energy managers with weather data that goes beyond degree day and bin data analysis. Recent advances in data transfer and software technologies have made this goal achievable. Future plans include additional cities and an interactive website. If you would like to offer comments or suggestions, I encourage you to drop me a note. Your input will be valuable in moving forward from here. ES
