|
FEBRUARY 2012 TREND LOG ANALYSIS
Last month’s trend graph showed about two weeks of 15-min interval data for selected points on a single zone, constant volume, mixed AHU. The system was equipped with airside economizer, heating hot water coil, and chilled water cooling coil for discharge air temperature control. The discharge air temperature setpoint was reset based on space temperature setpoint.
From the perspective of discharge air temperature setpoint maintenance, this AHU appears to have been performing extremely well. However, the way in which the temperature was being maintained is suspect.
First of all, during hot water the outside air damper minimum position appears to have been 0%, or fully closed. About halfway through the graph, after the weather had turned colder, the minimum outside air damper position appears to have been 10%. This raises the question of whether the facility operators were manually adjusting the programmed minimum outside air damper position based on weather conditions or was this programmed into the control sequence? In either case, why? There could be a number of reasons, some of which may be masking fundamental problems with the system, such as 1) is the cooling capacity of the air handler insufficient to properly condition10% outside air during hot weather?; 2) are there high-humidity problems when introducing outside air during hot weather; and 3) are the operators trying to save energy?
Second, in the middle third of the graph, during cool weather and airside economizer operation, there were a few times when the chilled water valve was modulating when the outside air damper was not 100% open. For the most effective airside economizer, the control programming should be tuned to prevent mechanical (chilled water) cooling from occurring until the outside air “free cooling” is at its maximum (e.g., outside air damper 100% open) and unable to maintain the setpoint discharge air temperature.
Third, at the end of the graph and still during the cold economizer weather, the outside air stayed at a constant 10% while the chilled water valve modulated to provide all of the discharge air temperature control. The absence of active airside economizing resulted in unnecessary chilled water (electricity) use and expense.
Finally, when the chilled water valve was modulating to maintain a constant discharge air temperature setpoint over an extended period of time, the valve control signal hunted between about 0% to 80% resulting in discharge air temperature swings of about ±4° around setpoint. This is not a major problem from a temperature control or energy perspective, but it does cause unnecessary wear and tear on the valve.
NEW SYSTEM
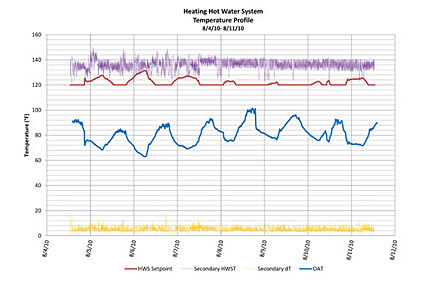
This month’s trend graph is for a central heating hot water system. The system consists of two high-efficiency modulating condensing hot water boilers with primary boiler pumps injecting hot water into a secondary distribution loop serving the building. The secondary loop includes variable-speed pumping and hot water supply temperature reset. As the outside air temperature decreases, the hot water supply temperature setpoint increases and vice versa. These boilers are located in a northern climate where winter heating and summer reheat are both critical for maintaining space temperature and humidity criteria.
The boilers are controlled by on-board manufacturer-provided controllers to maintain the secondary loop hot water supply temperature setpoint. The central BAS sends a temperature setpoint signal to the boilers, and the integral controllers modulate the boiler firing rates and the sequencing of the lead/lag boilers.
TRENDS
The BAS was used to trend the following sensor data at 5-min intervals for one week in August 2010:
• Secondary hot water supply temperature setpoint (red)
• Secondary hot water supply temperature (purple)
• Secondary hot water differential temperature = secondary supply temperature minus secondary return temperature (yellow)
• Outside air temperature (blue) ES


