
This article focuses on the types of cleanrooms categorized as dilution type found in the pharmaceutical industry — ISO7, ISO8, ISO9 — and the engineering tools available for designing such spaces.
Cleanrooms require the movement and filtering of air to remain clean, and lots of it! Moving that air is one of the largest consumers of energy in a cleanroom, and the cleanroom in general is often the largest energy consumers in an owner’s portfolio.
Despite what has been at stake in cleanrooms since their advent in the 1940s, there has been surprising little science applied to selecting the air changes needed to meet a specific cleanliness level. Industry practice has evolved empirically into rules of thumb. Some of these rules of thumb in the form of minimum air change rates for specific cleanliness levels have been written into regulatory good practice in the past. Recent changes in regulatory guidance language have removed these prescriptions, replacing them with language to engineer an acceptable solution.
As a result, industry can decide what air change rate is appropriate for the conditions within each cleanroom. With this new regulatory stance, air change per hour (ACH) rates in cleanrooms are being designed today 30% to 50% lower than the published guidance values.
In the past, owners elected to accept the published guidance values, but increasingly these guidance values are at odds with corporate drivers, including:
- Owner sustainability goals
- Operational cost savings
- Construction cost savings
Lowering ACH provides meaningful reductions in energy consumption, reducing the carbon footprint, and energy bills simultaneously. Reducing ACH also make the sizes of the air systems smaller, reducing construction costs, which is a win-win situation.
Fortunately, the engineering community has recently developed reliable engineering tools substantiated by field measurements to calculate the expected performance and operation of a cleanroom before it is built, finally enabling the responsible pursuit of these corporate drivers.
Air Change Reduction
This article focuses on the tools available to assess the impacts of air change reduction.
The empirical rules of thumb developed because of the lack of viable engineering tools and reliable metrics on the sources of particles in cleanrooms. This is true of both laminar-flow-type cleanrooms used in ISO 5 spaces and cleaner, used mostly by the semiconductor industry, and dilution-type cleanrooms of ISO6 and dirtier, used primarily by the phramaceutical and food industries. This article will focus on the dilution-type cleanrooms.
New tools including those in ASHRAE Design Guide for Cleanrooms, Fundamentals, Systems, and Performance 2017and computational fluid dynamics (CFD) modeling, are illuminating the gap between the necessary conservatism of empirically derived historical air change rates and engineered air change rates that reduce energy consumption, yet minimize risks of contamination. Both of these tools are helpful in this analysis, yet each has its drawbacks, and advantages. When used together, safe and economic air change rates can be selected for each cleanroom.
Dilution Equation Approach:
The use of the dilution equation approaches as outlined in ASHRAE Design Guide for Cleanrooms is straightforward, low cost, and certainly a better guide than rules of thumb. These approaches are effective when combined with significant professional experience. There are several equations that could be used depending on the situation. In general AEI has utilized the work of Sun, et al., for our work.
This approach assumes the particulate sources in the cleanroom are diffused uniformly, yet the primary particulate source in all cleanrooms are the people, and act more like point sources. Additionally, particulate at 0.5 micron tends to follow the airflow streamlines and does not diffuse uniformly in air. Therefore, a safety factor needs to be built into the dilution equation approach to compensate for the potential concentrated particulate in close vicinity to an individual in a cleanroom, but how much of a safety factor?
This approach provides one value for the entire room that represents the average particles/unit volume across the entire room. It can not account for poor placement of the HEPA filters or the return air openings in the room that could cause one part of the room to not flush the particles from all parts of the room.
The diffusion equation relies upon a factor for the efficiency of the supply air “diffuser” to mix the supply air within the air in the cleanroom. The greater the mixing the lower the likelihood of stagnant and therefore dirty air, otherwise known as the ventilation efficiency factor. This factor has a powerful effect on the results of the equation, yet very little is known about the real ventilation efficiency of a terminal HEPA filter. The ventilation efficiency of most common HVAC diffusers has been researched and quantified, most are documented to have ventilation efficiencies of 80% to 95%, and thoroughly spread the air entering the room along the ceiling. The current minimal guidance suggests the ventilation efficiency of terminal HEPA filters are 50% to 70%.
This approach does an excellent job representing the effects of the filter system, the percentage of outdoor air, and the effects of the outdoor particulate load on the cleanliness of the air entering the space via the terminal HEPA filters.
Due to the limitations of this approach, the results still require significant experience and judgement before being used as the basis for a cleanroom air system design.
Computational Fluid Dynamic (CFD) Modeling:
CFD models account for the geometry of the room and movement of the air within the space, momentum, thermal buoyancy from heat sources in the room, and the obstructions caused by the equipment. The model also accounts for the location and velocities of all air inlets and outlets. People are modeled as the source of particulate in static positions, typically at intended workstations. The detail required to set up the models requires significant engineering time ranging from,60 to 80 engineering hours per room to provide a combination of airflow and particulate analysis. Changing the models to test various options incurs significant engineering hours as well. This is a significant barrier to the application of CFD models to every cleanroom design.
The results are also very specific to the locations of equipment, people, HEPA filters, and return grille locations. CFD analysis shows that despite the same fundamentals of the air change rate, room shape, and number of people in the space, the placement of the equipment, people, and number/locations of HEPAs and return grille locations can have a dramatic effect on the performance of the cleanroom.
Comparison of Methods:
Below we apply both methods to three sample rooms to compare results of the two methods. These rooms are built and operational and were designed using empirically derived air change rates. The intent of this comparison is use the results of the CFD models to corroborate the application of the dilution equation, and extract design principles from looking at the CFD models that when applied to a cleanroom design increases the assurance that the use of the dilution equation will be representative.
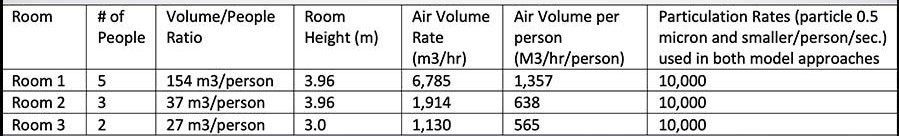
When considering how to design a cleanroom the first consideration is the number of people in the room, usually the primary if not the only source of particulate in the room, and more precisely the density of people in the room, which accounts for the room volume into which the particulate can disperse. See the table below for these fundamental ratios within these rooms.
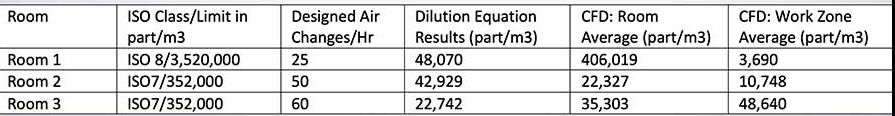
Below are the particulate concentrations calculated from the two methods. In the CFD analysis the particulate concentrations were calculated for the room as a whole and for the zone at work bench surfaces and above to 30”. The table show both methods yield similar results, both methods show particulate levels approximately one order of magnitude cleaner than the action limits.
The results from the CFD models for the three rooms show more detail and are more instructive than the single value obtained from the dilution equations. Perhaps unsurprisingly, the lessons from these CFD models most part confirm many of the known good practices of cleanroom design.
HEPA Pattern and Symmetry:
The CFD models show that if the gaps between filters exceed 4 feet, the potential for an eddy between these HEPAs can trap particulate in the eddy creating the potential for the particulate counts to exceed the limits. The HEPA filter locations in Room 1 are irregular with wide gaps (over 5 feet) and the model shows particulate being trapped in an eddy in the gap between the HEPA in the plan north part of the room. This room calculated and tested within particulate limits despite this eddy, but this is no reason to accept poor placement of the HEPAs.
Asymmetrical return airflow can exacerbate the tendency of a HEPA filter placement pattern to cause particulate-trapping eddies. The return airflow in Room 1 is heavily asymmetrical with 8,200 cfm being returned on the south hall of the room and 3,300 cfm returned on the north end. This asymmetry contributes to the particulate trapping eddy on the north side of the room.
Placing the HEPA over a large piece of tall lab equipment significantly increases the chance of and eddy that traps particulate in the room.
The results are better if more HEPAs are used at lower discharge air quantities for the same total quantity of air. This can be seen by comparing the 325 cfm from each HEPA in Room 2, to the 480 cfm per HEPA in Room 3. Room 2 at 50 ACH and three occupants outperforms Room 3 at 60 ACH and two occupants in the CFD model. The results of the dilution equation can account for better air distribution with it’s ventilation effectiveness factor (VEF), but no correlations are available in the literature between the percentage of HEPA filter ceiling coverage and this VEF.
CFD models will often show the time needed to remove a particle from the space when modeling the operational condition. This time can be indicative of time needed to meet the “at-rest” conditions required for EU licensure.
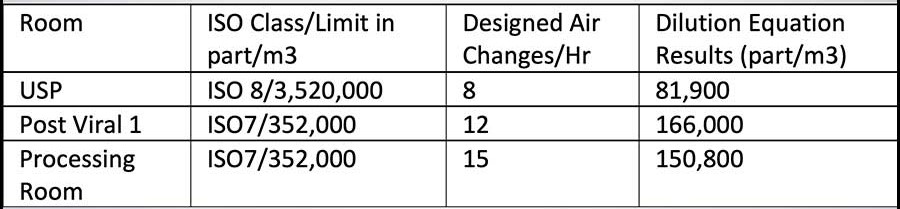
Given the lessons discussed above, we don’t want to design to the action limits but want to leave a reasonable margin between the calculated values and the action limits. The table below shows the ACH needed to keep the particulate at approximately 50% of the action limits.
Conclusions
The new engineering tools reviewed here are a significant improvement over the use of empirical rules of thumb. Learning from the results of CFD analysis of similar rooms can improve the placement of supply HEPAs and return grilles in all cleanrooms, and to provide a higher assurance that a room analyzed by the diffusion equation only will perform well.
The use of CFD analysis for every room in a cleanroom suite can be prohibitively expensive to engineer, yet the use of the dilution equation alone can have less-than-ideal results. Doubts remain about the ventilation effectiveness of today’s terminal HEPA filters, and more research is needed to find the air movement patterns from a HEPA that might suppress eddies that are shown in the CFD models examined here to retain particulate within the room, rather than flushing the room of particulate more effectively.


