


When specifying cooling equipment, engineers are faced with myriad decisions affecting performance and layout. One critical consideration is the noise emitted.
As population density rises in major cities and municipal bylaws limit sound levels, this can be the determining factor when deciding between two commercial cooling systems.
Manufacturers can choose from multiple sound test codes, but the results should not depend on the methods chosen. It is critical for tests to provide results that are consistently tight and verifiable so that engineers and owners can be confident in the accuracy of given values.
Because of the need to compare and contrast widely accepted industry testing methods, Evapco conducted tests on four of their cooling tower units using multiple standards to calculate and compare sound power levels.
This article summarizes the results of those tests and makes recommendations for bringing the results closer together. It’s worth noting that a revised version of ATC-128, standard for the measurement of sound from water cooling towers by the Cooling Technology Institute (CTI), is expected soon. It will include an updated method of interpretation of test data from small cooling equipment to bring sound power levels closer to ISO 3744 Hemispherical Method.
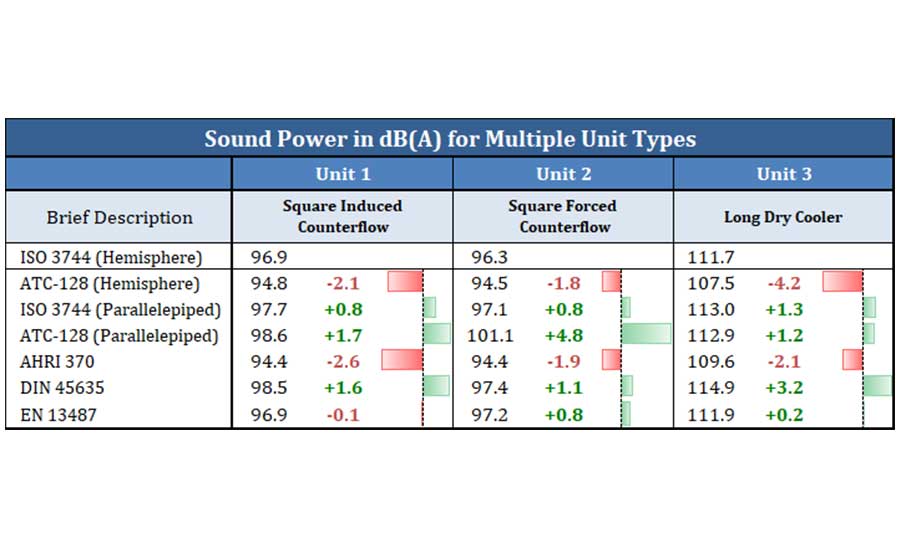
Table 1: A table summarizing the surface area equations for the standards.
Looking Back
In 1981, the CTI introduced ATC-128, “Test Code for Measurement of Sound from Water Cooling Towers,” a standard for testing the sound emitted by cooling towers. The intent of ATC-128 was to standardize manufacturers’ attempts to measure the noise emitted by their cooling equipment and to calculate sound levels at various distances. Prior to its release, companies turned to international codes or internal protocols to measure equipment sound levels.
CTI’s aim to bring consistency to the North American market has been largely successful. However, the code includes multiple measurement methods, raising questions about how best to select the most accurate sound calculations. This is especially important for obtaining or extrapolating results to distances that are not directly tested but which are needed for compliance with noise ordinances and bylaws.
CTI carried out a major rewrite of the code in 2005, followed by a smaller revision in 2014. As part of its ongoing development of codes and standards that can be trusted, the institute engaged Evapco to carry out testing at its research and development center in Maryland.
Methodology
In order to determine where ATC-128 lies in relation to comparable codes, testing was done using methods from ATC-128 and four other standards that use measured data to calculate sound power levels:
- ISO 3744 (Acoustics – determination of sound power levels and sound energy levels of noise sources using sound pressure – Engineering methods for an essentially free field over a reflecting plane);
- Air-Conditioning, Heating and Refrigeration Institute (AHRI) 370 (Sound Performance Rating of Large Air-cooled Outdoor Refrigerating and Air Conditioning Equipment);
- The German Institute for Standardization (DIN) 45635, Part 46 (Measurement of Noise Emitted by Machines; Airborne Noise Emission; Enveloping Surface Method; Cooling Towers); and
- EN 13487 (Heat Exchangers – Forced Convection Air Cooled Refrigerant Condensers and Dry Coolers – Sound Measurement).
These methods were chosen because, like ATC-128, they use measured sound pressure to calculate sound power levels. Sound pressure is a measure of the fluctuations in air pressure caused by sound waves travelling through the air. Essentially, it is the sound we hear at a given distance from the source and is measured in decibels (dB).
The sound power level from the source must be calculated from measured sound pressure since the nature of sound travel makes it almost impossible to measure directly. These measurements are taken typically at eight wavelength frequencies, known as octaves, that make up the audible sound spectrum: 63, 125, 250, 500, 1,000, 2,000, 4,000, and 8000 Hz.
For the analysis, these measured values are “weighted,” which converts them based on the human ear’s sensitivity to some sound frequencies over others. This is done using conversion values for the results at each frequency; all values stated in this article are weighted and are in dB(A) instead of the measured dB(L).
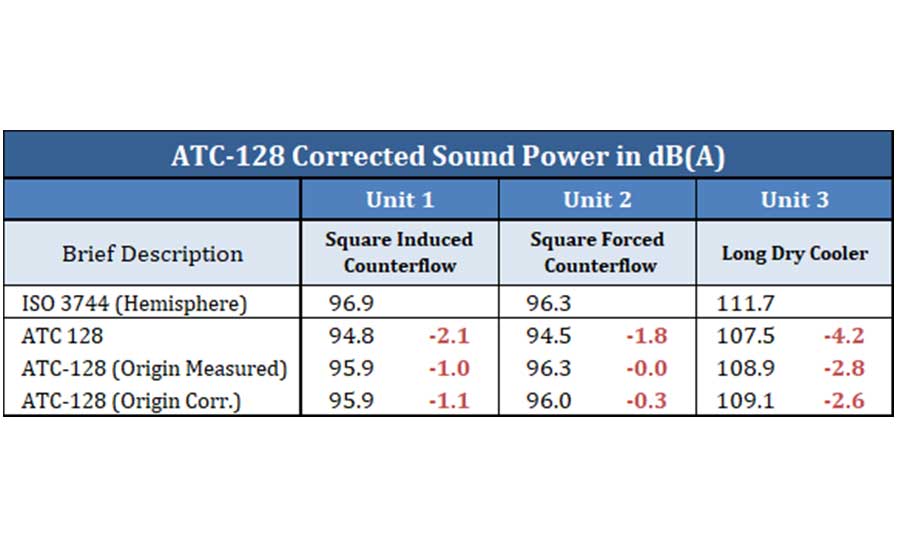
Table 2: A comparison of sound power showing deviations from baseline.
Cooling Units Used for the Tests
Four units were tested: an induced draft, counterflow cooling tower; a forced draft, counterflow cooling tower: an induced draft, crossflow dry cooler; and an induced draft, crossflow cooling tower.
Variations in shape and operation allowed for an analysis independent of configuration. In all cases, the units ran with no heat load at maximum fan speed and water flow (where applicable).
Each unit was subject to testing according to the five standards (ATC-128, ISO 3744, AHRI 370, DIN 45635, and EN 13487), and the sound power was calculated using the guidelines in the standards.
It is important to understand the two types of measuring distances that are used to calculate sound power. One is nearfield, which is the area around the unit that is so close that the unit surfaces cannot be grouped as a single emitting point. Calculating the sound power is challenging since measurements appear to come from various directions.
Far-field distances treat the unit as a point from which sound emanates. The minimum far-field distance is based on a characteristic dimension calculated from the equation:
D_o=√((UnitLength/2)^2+(UnitWidth/2)^2+(UnitHeight)^2 )
Equation 1
Far field is generally considered to be two times this characteristic dimension (2Do).
Evapco’s test facility allowed for measurements to be taken with minimal interference since the test pad has a clear space around it of 50 feet in each direction without significant interference. This was key in obtaining far field measurements, as required.
Tests Conducted
From September to December 2017, tests were conducted in exact accordance to the methods specified by each of the five standards to be compared.
ATC-128 — The CTI’s standard contains multiple methods. For comparison, nearfield and far-field measurements were taken to calculate sound power levels. These were recorded at the center of each cooling tower face and provided two datasets that could then provide a comparison between the two calculations. While far-field is considered to be twice the characteristic dimension Do, the industry uses a set distance of 15 m (50ft).
Measurement elevations for ATC-128 were 1.5 m from the ground, except where this coincided with a fan discharge. To prevent the airflow from inflating the measured values, these readings were taken 1.5 m above and 1.5 m to the side of the outlet. All 15-m distances were measured from the face of the cooling towers as opposed to the center of the units, as per ATC-128 guidelines. This fact is key in accounting for deviations from baseline calculated values and is discussed in the results.
ISO 3744 — This standard works for multiple types of machinery and equipment and is the most widely used because of its extensive scope.
The basic arrangement is to take readings of sound pressure from a hypothetical surface that surrounds the noise source. An array of measurement points on these “surfaces” is used to calculate the total sound emission.
A hemisphere was used for this test with its center at the middle of the unit’s base. The radius was two times the characteristic dimension, giving far-field readings. Ten primary points and 10 secondary points were measured at various locations along the hemisphere and these were used to calculate sound power levels.
The other shape was a box that extended to a distance of 1 m from the unit in each direction. Known as the “parallelepiped” method, it was used to obtain nearfield readings. Each face was separated into a grid with the measurement points at the center of each face. The corners and midpoints of each face are mandatory locations, while additional measurements may be taken if required.
AHRI 370 — This standard was approved by the American National Standards Institute (ANSI) in 2015, nearly 30 years after its first publication.
Unlike ISO 3744, which covers a broad array of equipment, this standard is specific to refrigeration and air conditioning equipment larger than 40 kW. It consists of taking measurements 1 m from each face of the unit, at two heights: 1.5 m above the ground and 1 m higher than the top of the unit.
The array of readings consists of the midpoint of each face and points 1 m apart in a ring around the unit at each of the two elevations. For units that are less than 2 m tall, the reading 1 m above the top of the unit is not required.
DIN 45635: Part 46 — The German Institute for Standardization issued this code to measure sound emitted by machines with part 46 dealing specifically with cooling towers. It gives the method of measuring specific points surrounding natural and mechanical draft cooling towers with a focus on the locations identified as the sound emitting areas of the unit. Near-field distances were used to obtain these readings.
For the mechanical draft units tested, four locations were assessed: the air inlet, the outlet, fan stack, and motor. Each location had a set of measuring points forming a shape around that portion of the unit. The inlet and motor were surrounded by points on a cuboid while the fan stack had readings taken radially along a cylinder surrounding the fan.
A hemisphere around the air outlet sat on top of the fan cylinder to get sound readings associated with the discharge.
Since the units tested had internal motors, there was no separate set of readings for the motor. For the inlet, readings were taken 1 m from the inlet face at three elevations: 1 m above the top of the inlet louver and ¾ and ¼ of this height from the ground.
Similarly, the fan stack cylinder consisted of four sets of readings taken 1m away from the stack, measured at three elevations.
EN 13487 — EN 13487 is the European standard issued by the European Commission for Standardization and covers forced air-cooled refrigerant condensers and dry coolers. It uses a parallelepiped method that attempts to account for the fact that moving air from the fans would interfere with readings taken too close to discharge points.
For this reason, the measurement locations were extended 1 m from the corners of the box surrounding the unit as opposed to the typical midpoints used in other methods. For units with multiple fans, points were also taken at midpoints between fans.
For units with fans in a vertical plane, the points are taken 30 cm above the ground and 1 m from the front of the unit. Rear points are offset by 0.5 m from the back end instead of 1 m.
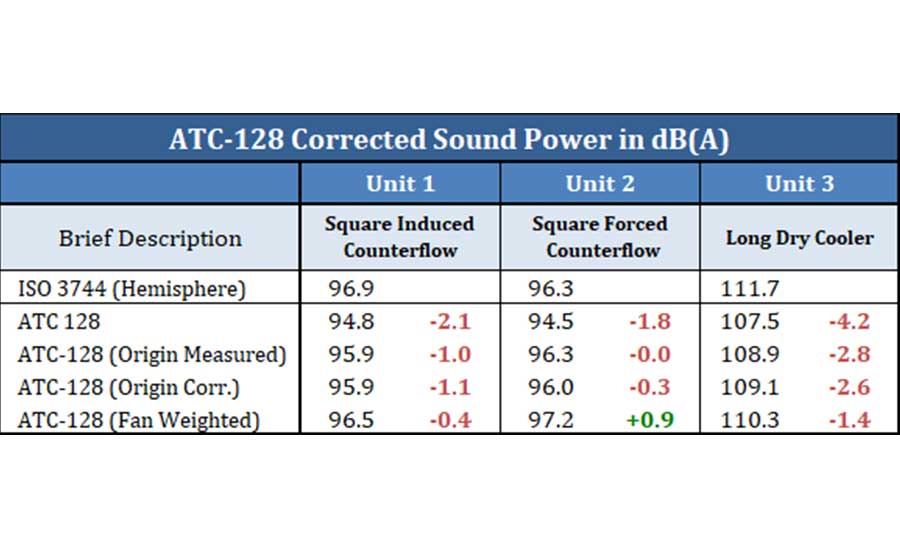
Table 3: Results of recalculated sound power levels using corrections to the origin point.
Calculating sound power
The equation for calculating sound power is:
SoundPower=〖SoundPressure〗_Avg+Corrections+GeometricTerm
Equation 2: Where the average sound pressure is determined using the equation found in ISO 3744:
〖SoundPressure〗_(Avg*)=10∙log_10[1/〖SA〗_T ∙∑_(Point=1)^n▒(〖SA〗_Point∙〖10〗^((0.1∙〖SP〗_Point ) ) ) ]
Equation 3: Where SAT = Total geometric surface area of measurement plane
SApoint = Surface area allocated to the point where the measurement is taken
SPpoint = Sound pressure measured at a point
n = number of points
For units that have data points with equal surface area, equation 3 can be simplified to:
〖SoundPressure〗_(Avg*)=10∙log_10[ 1/n∙∑_(Point=1)^n▒(〖10〗^((0.1∙〖SP〗_Point ) ) ) ]
Equation 4: The corrections take into account the background noise, reflections, atmospheric absorption, etc. For the tests carried out here, the measured background sound was insignificant. Therefore no correction was used since they were all done with the same ambient conditions.
The geometric term takes the measured surface area into account:
GeometricTerm= 10∙log_10〖[SA],〗 where SA is the surface area
Even though all the standards use the same equation, calculation methods for surface area vary between standards for nearfield areas. The far-field equations, on the other hand, were identical and based on a hemisphere whose radius was the distance from the unit.
Below is a table summarizing the surface area equations for the standards:
Nearfield Far-Field
ISO 3744 SA=4∙(ab+bc+ca)
a=0.5∙L+d
b=0.5∙W+d
c=H+d SA=2π∙〖distance〗^2
ATC-128 SA = Not Defined = Assumed Same As ISO SA=2π∙〖distance〗^2
AHRI 370 SA=Same as ISO 3744
Or
SA=π∙((L+2m)/2)∙((W+2m)/2+(H+1m)) -
DIN 45635 〖SA〗_AirOutlet=2π∙(FanRadius+1m)^2
〖SA〗_Stack=2π∙(FanRadius+1m)∙StackHeight
〖SA〗_Inlet=a∙b+(2a+b)∙c
a=H_TopOfLouver+1m
b=AirInletWidth+2m
c=LouverExtensionFromFace+1m -
EN 13487 SA = Not Defined = Assumed Same As ISO -
Note that AHRI has two nearfield equations: one identical to the ISO equation and one based on a hemispherical equivalency. This second equation was meant to account for equipment with a long, narrow shape, and when used, it gives sound power levels that are lower by 2-3 dB(A).
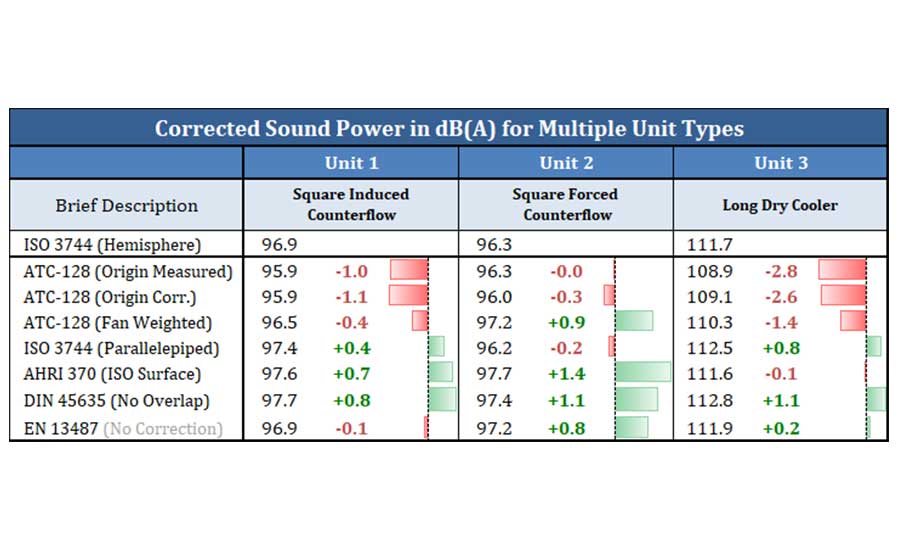
Table 4: A summary of recalculated sound power levels using origin and fan weighted corrections.
Results
All test results were compared to ISO 3744, which was used as the baseline standard for measuring and calculating sound levels. The results of tests taken for the induced draft, counterflow cooling tower (unit 1) will be presented here and compared. More information is contained in the original document TP18-27 from the Cooling Technology Institute.
Nearfield Calculations
ISO 3744 — For the ISO calculation using readings taken from the parallelepiped method, the two methods of averaging the sound pressure were used and compared. The simplified version assumes that each point has the same surface area (shown by equation 3) and it gave a sound power of 98.4 dB(A), while the more detailed calculation using equation 4 resulted in a sound power of 97.7 dB(A). The more detailed calculation accounted for variations in surface area, thus 97.7 dB(A) was deemed the more accurate to be used as the baseline reading.
ATC-128 — ATC-128 does not have its own nearfield equation, so the ISO equation for varying surface areas (equation 4) was used. The total sound power obtained from the readings using ATC-128 was 98.6 dB(A).
AHRI 370 — The hemispherical equivalency equation was used to calculate the AHRI result, which gave a surface area of about half the expected surface area calculated with the ISO method. The average sound pressure was also lower and the resultant sound power level was 94.4 dB(A).
DIN 45635 — Since this standard only uses areas around sound emitting parts of the unit, the calculation was more complex and included overlapping enclosures. One side of the unit had a higher average sound pressure, since the motor sound affected nearby air inlet sound measurements. The average sound pressure using this standard was 98.5 dB(A).
EN 13487 — This standard is similar to ISO and AHRI 370 standards but with fewer points from the corners of the unit instead of midpoints. Data points had to be relocated due to proximity to airstreams, and the resulting sound power was 96.9 dB(A).
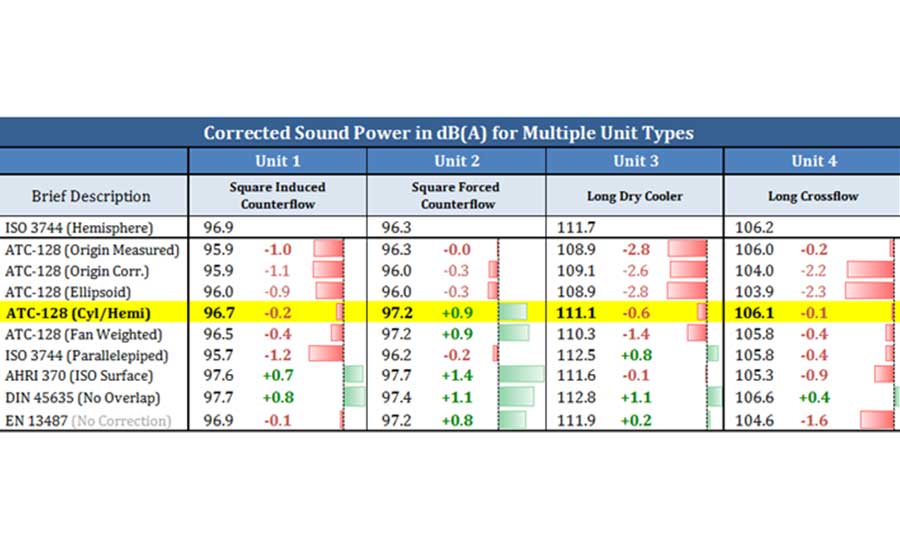
Table 5: A comparison of sound power showing deviations from baseline once corrections were implemented.
Far-Field Calculations
Only the ISO 3744 and ATC-128 contained far-field methods for calculating sound power levels. The ISO value was used as baseline against which the ATC-128 result was compared.
ISO 3744 — Measurements were taken on a hemisphere at a 15-m radius with 10 primary points and 10 secondary points collected for comparison. Using only the primary points gave a sound power level of 97.2 dB(A), while the secondary points gave a result of 96.6 dB(A). The final calculation, based on all 20 readings, was 96.9 dB(A), which was the baseline used.
ATC-128 — The readings for this code were all taken at 50 feet from the face of the unit, although the calculation assumes the readings are taken from the centerpoint of the unit’s base. Hence, the assumption is that all the data points lie on the same hemisphere, giving a lower surface area and sound pressure. The calculated sound power was 94.8 dB(A). Table 2 provides a comparison of the results for the three units.
The ISO far-field values using the hemispherical model was used as the baseline against which all other results were compared, due to the uniformity of data collection. The ATC-128 calculations were lower than baseline for all three units. This was likely due to the fact that the calculation assumes that points are measured from the center of the unit rather than the unit faces as per the ATC-128 method.
The nearfield sound pressures were higher than the baseline readings for all methods except AHRI 370, which was lower, and EN 13487, which was very close to the baseline.
Options for Improvement
One of the aims of this test was to determine ways to possibly improve the methods used to make them more accurate and consistent.
ISO 3744 Parallelepiped Method — Besides ambiguities about which data averaging method should be used, ISO 3744 parallelepiped method may have resulted in inflated sound pressure readings at points located in airstreams. Removing these readings from the data set and recalculating the sound pressure values gave results that were closer to baseline.
For unit 1, the difference changed from +0.8 to +0.4 dB(A).
For unit 2, this difference went from +0.8 to -0.2 dB(A).
For unit 3, the difference was reduced from +1.3 to +0.8 dB(A).
AHRI 370 parallelepiped method — Using the ISO 3744 area calculation for the AHRI 370 parallel piped method instead of its suggested equivalency area calculation brought those readings closer to baseline. The sound pressure for unit 1 went from 2.6 dB(A) below the baseline to 0.7 dB(A) above baseline. Units 2 and 3 went from -1.9 to +1.4 dB(A) and -2.1 to -0.1 dB(A) respectively.
DIN 45625 — The DIN 45625 enclosures were overlapped for unit 1, which was small and contained multiple inlets. This inflated the surface area, resulting in the deviations from baseline. Modifications to the enclosures to remove this overlap resulted in a difference from baseline that went from +1.6 to +0.8 dB(A). Similarly, the fan discharge enclosures for unit 3 overlapped at the fan cylinder edges. Removing the overlapped area brought the sound power level closer to baseline from +3.2 to +1.1 dB(A).
ATC-128 — ATC-128 presented two main options for corrections based on limitations discovered during testing and calculations. One was a location-based correction that changed the distance from the unit that readings were taken. The other was a calculation-based correction that accounted for the fact that the distance is measured from the face of the unit rather than the midpoint.
ATC-128 Location-Based Corrections
Readings were taken at a distance of 2. Do, as per equation 1, to compare results to readings taken at a distance of 15 feet. The resultant sound power was 4 dB(A) below baseline, further than the 2.1 dB(A) deviation using 15 feet. This result shows that it is safer to do readings at 15 feet to ensure that far-field has been reached, as long as there is no significant background noise.
Measuring the 15 foot distance from the center of the unit rather than the unit’s face brought the calculated sound power levels closer to baseline. Unit 1’s deviation went from -2.1 to -1.0 dB(A), unit 2 changed from -1.8 to 0.0 dB(A), and unit 3 went from -4.2 to -2.8 dB(A). This is because the calculation for sound power assumes that the points all lie in the same hemisphere, which they do not if they are measured at equal distance from the face rather than the origin.
Moving the points to 15 feet from the origin puts them on the same hemisphere, making the calculated value closer to the ISO 3744 baseline.
ATC-128 Calculation-Based Corrections
Using readings measured from the unit’s face, the calculation was modified to account for the fact that each point lies on a different hemisphere with an origin at the center of the unit. Thus, the surface area was recalculated for each datapoint using the distance from the unit’s origin (even though the readings were still taken 15 feet from the unit’s face). This correction brought the sound power levels closer to baseline as shown in the Table e.
Ultimately, both methods of correction gave similar results.
Another way to modify the calculation was to calculate what the sound would be on a common hemisphere by mathematically “relocating” the measured values. This gave resulting sound power values that were identical to those obtained from readings taken at 15 feet from a common origin at the center of the unit.
Taking a step further, we can combine the common origin calculation with a fan weighting to account for the fact that the majority of noise comes from the fan and motor.
So, instead of assuming that each reading accounts for an equal share of the noise (1/5), we apply a greater weighting to the point in the fan discharge. As a starting point, the fan was assumed to account for three times more noise than the other four locations.
The calculation was completed using the fan reading three times so that it accounted for 3/7 of the sound while the other points accounted for 1/7 each. Units 1 and 3 were even closer to baseline than using the origin correction only.
Recommendations for ATC-128
As shown in Table 2, the scatter between results using different methods was as high as 4.8 dB(A). The modifications investigated yielded sound power levels that were closer to baseline. Table 5 demonstrates the spread from baseline and shows that once these changes were implemented, the variation did not exceed 1.5 dB(A).
ATC-128 initially gave the most deviant results compared to the other standards. Once the location- and calculation-based changes were implemented, the sound power levels more closely approached the baseline, which was considered to be the most accurate.
The fan weighted calculation combined with data point corrections yielded the best results and should be considered for inclusion in the code, once further testing is done on various unit configurations to ensure the trends still apply.
It is important to note that EN 13487 was a simple method that gave the closest results to the baseline without needing any correction. For this reason, the approach is also recommended for consideration in future revisions of ATC-128.
The sound pressure levels of a fourth unit, an induced draft, crossflow cooling tower, were measured afterward, following the same methods described before. Those results, in addition to the sound power results of Table 5, are presented in Table 6.
Conclusion
While much attention is focused on energy conservation and optimizing HVAC system performance, it’s also important to ensure that outdoor equipment sound levels do not exceed bylaw limitations.
Manufacturers can choose from multiple codes for determining sound levels. However, this introduces the risk of inaccuracies if the results depend on which test is chosen.
Investigating and implementing changes to remove variations between codes will give engineers more confidence in the sound levels reported by manufacturers. This will help designers to make the right decisions for cooling systems that meet requirements for both performance and sound levels.
A revised version of ATC-128, standard for the measurement of sound from water cooling towers by the CTI will be published in 2019. It will include an updated method of interpretation of test data from small cooling equipment to bring sound power levels closer to ISO 3744 Hemispherical Method.


