
|
FEBRUARY 2012 TREND LOG ANALYSIS
Last month’s trend graph showed about two weeks of 15-min interval data from the BAS for selected points on a single-zone, constant volume, mixed AHU. The system was equipped with airside economizer capability, heating hot water coil, and chilled water cooling coil for discharge air temperature control. The discharge air temperature setpoint was reset based on space temperature setpoint.
The trend data was from the fall of 2010 when outside air temperatures varied between 30°F to 60°, a good time to observe economizer operation. What the trend graph tells us is that the AHU was providing excellent temperature control. Its discharge air temperature line was tracking nearly identical to its setpoint.
Based on the outside air damper and hot water valve trends, however, the system was not achieving this desired temperature control as efficiently as possible. There were many times when the hot water valve was open as much as 50% or 100% while the outside air damper was not in its minimum position (10%). This means that the hot water was being used to heat more cold outside air than necessary, using more energy than required.
This imprecise control would be nearly impossible to observe without the trend logging capability of the BAS. It is an example of how the power of DDC can and should change the way building operators manage and evaluate their systems. Correcting the control system programming should be a low-cost energy conservation opportunity requiring neither hardware nor installation labor; the challenge is knowing that it needs to be done. That is where proactive trend log analysis comes in handy.
NEW SYSTEM
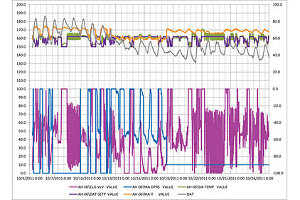
This month’s trend graph is of the same type of single-zone, constant volume, mixed AHU with airside economizer, heating hot water coil, and chilled water cooling coil for discharge air temperature control. The discharge air temperature setpoint is reset based on space temperature setpoint. This graph has a selected number of points with two different vertical axes (one on the left and one on the right) to help see and evaluate the pertinent points more easily than with a single shared axis.
TRENDS
The BAS was used to trend the following sensor and device data at 15-min intervals for a little more than three weeks in the fall of 2011:
Left Hand Vertical Axis:
• Mixed air (outside air) damper command (blue)
• Heating valve command (magenta)
Right Hand Vertical Axis:
• Outside air temperature (gray)
• Mixed air temperature (orange)
• Discharge air temperature setpoint (purple)
• Discharge air temperature (green) ES


