DECEMBER 2011 TREND LOG ANALYSIS
Last month’s trend graph was for an AHU serving a museum’s below-grade unoccupied art storage vault in a northern climate. This was a constant volume, single zone system with a mixing box, chilled water coil, heating hot water reheat coil, humidifier, and supply fan. The museum’s art conservators expected to maintain 70°F and 40% to 50% rh year round. There was no airside economizer, but there was a minimum outside air damper open at all times.
The trend graph shown in last month’s column indicated that the control system was doing a great job of maintaining space temperature at a very steady 70°. The heating hot water coil pump and the heating hot water valve were called into play for dehumidification reheat purposes a few times during the 10-day trend period. Otherwise, the heating hot water valve was fully closed.
When not dehumidifying, the chilled water valve was modulating between 30% to 40% open to maintain the space temperature setpoint. There was a direct correlation between the discharge air temperature fluctuation (up and down around an average of approximately 70°) and the chilled water valve modulation. This all seemed to make sense.
The anomaly, however, was the fact that the mixed air temperature was consistently about 65°, which was 5° lower than the discharge air temperature. How was the air temperature increasing from 65° to 70° if the hot water valve was closed and the chilled water valve was partially open? The fan will always add some heat to the airstream, but this was not a big enough fan/motor to account for the greater-than-5° temperature rise illustrated in the graph. The steam humidifier, although not active during this trend period, may also have accounted for a slight temperature rise.
The only other potential source of heat between the mixed air sensor and the discharge air sensor was the heating hot water valve, and this trend data proved that hot water was leaking past the closed valve into the heating coil. The chilled water valve compensated for this failure by opening to remove the excess heat introduced by the leaking valve. As such, the failure did not manifest itself in loss of environmental control in the art storage vault, and no one at the museum was aware of a problem.
Repairing the hot water valve resulted in over $4,000/year in cooling and heating energy savings by eliminating the unnecessary simultaneous heating and cooling.
NEW SYSTEM
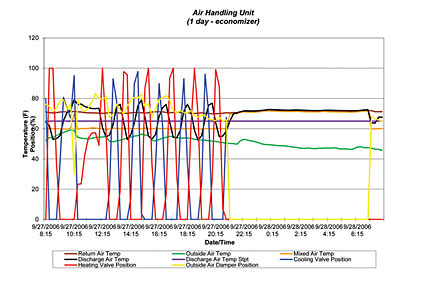
This month’s trend graph is from the same museum as last month’s art storage vault. This is a large constant volume air handler delivering constant 55° supply air to terminal reheat coils serving multiple temperature control zones. These temperature control zones are primarily art galleries open to the public during the day. The AHU consists of a mixing box with airside economizer, heating hot water preheat coil, chilled water coil, humidifier, and supply fan. This trend was created as part of a retrocommissioning project looking for low cost/no cost energy-efficiency measures.
TRENDS
The BAS was used to trend the following sensor and device data at one-minute intervals for a single day in the fall of 2006:
• Return air temperature (brown)
• Outside air temperature (green)
• Mixed air temperature (orange)
• Discharge air temperature (black)
• Discharge air temperature setpoint (purple)
• Chilled water valve signal (blue)
• Heating hot water valve signal (red)
• Outside air damper signal (yellow) ES


