
A computer simulation, or model, of a chiller plant must, by the author’s definition, duplicate the performance of the real plant within 1%-3% to qualify as a tool to design and evaluate the plant at any and all operating conditions. Accomplishing 1%-3% duplication of real chiller plant performance requires an equation for all components of a plant that effect the performance of the plant. The equations must be solved simultaneously so that the effect of all components of the system are at equilibrium with all other components. Each component of a real chiller plant and a chiller plant model affects the performance of other components as conditions change. The chiller and tower are the primary components of a chiller plant and, therefore, must have very actuate thermodynamically correct equations to accomplish the 1%-3% requirement.
This article, Part 2 in this series, will show that the System Energy Equilibrium (SEE) Plant Model can duplicate the performance of the Kansas City chiller/tower manufacturer’s data presented by an ASHRAE article1. The next article, Part 3, will show duplication of Trane’s2 chiller selection data, and Part 4 will show compliance with and the importance of the tower in the performance of a chiller plant. These four articles establish the validity of the SEE Plant Model so that further analysis and understanding of chiller plants can be achieved.
SEE Plant Model Challenges
Figure 1 gives the evaporator load and wet bulb temperature at peak 1,000 ton and 78°F wet bulb decreasing to 300 ton and 64° wet bulb as given by Schwedler1. This variation in load and wet bulb represents a significant challenge for the SEE Plant Model, especially due to the tower operation at both 100% and 50% fan speeds. The following will show that the SEE Plant Model can duplicate this Schwedler chiller/tower data within 3%.
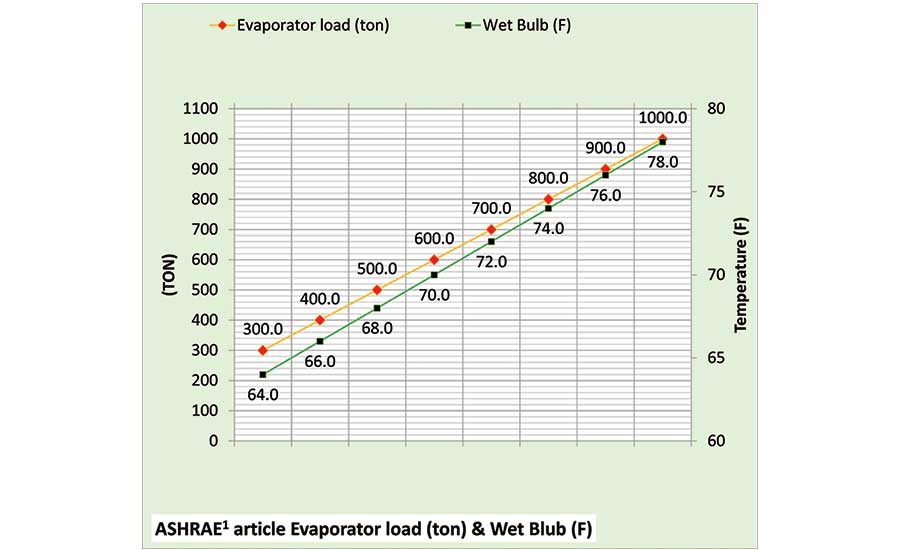 Figure 1. Evaporator load (ton) and wet bulb temperature as given by an ASHRAE article.
Figure 2 gives the Schwedler tower cold water approach to wet bulb, where wet bulb temperature plus tower approach temperature equals tower cold water temperature. Figure 2 also illustrates the complexity of the tower performance at 100% and 50% tower fan speed operating against the loads of Figure 1. The SEE Plant Model duplicates the data of Figure 2 within 3% as shown below.
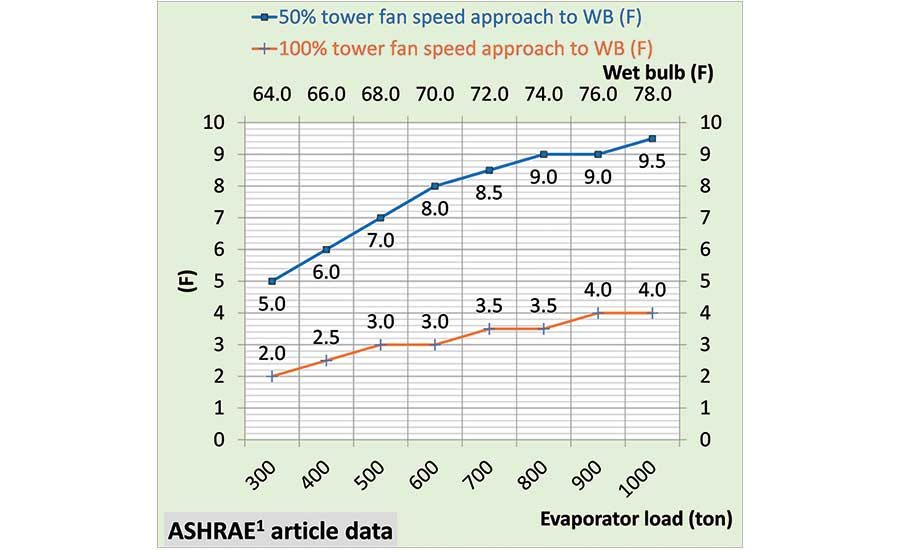 Figure 2. Tower cold water approach to wet bulb temperature given by Schwedler.
Figures 3A and 3B give the ASHRAE article chiller kW and entering condenser water temperature for both 100% and 50% tower fan speeds, respectively, illustrating the significant difference in chiller performance at these two tower fan speeds.
 Figure 3. Chiller kW and entering condenser water temperature (ECWT) at 100% tower fan speed.
Figures 3A and 3B also illustrate that the increase in chiller kW with 50% tower fan speed is not a linear function. Chiller kW increases about 10% at peak 1,000-ton load and only 4.6% at 300-ton evaporator load.
Figure 4 further illustrates the challenge for the SEE Plant Model to mathematically define a plant that duplicates the chiller/tower data. Curve fitting or some other math gyration will not accomplish the task of 1%-3% duplication of the real chiller/tower data at any operating condition. A real chiller/tower operates according to the laws of thermodynamics and so must the SEE Model.
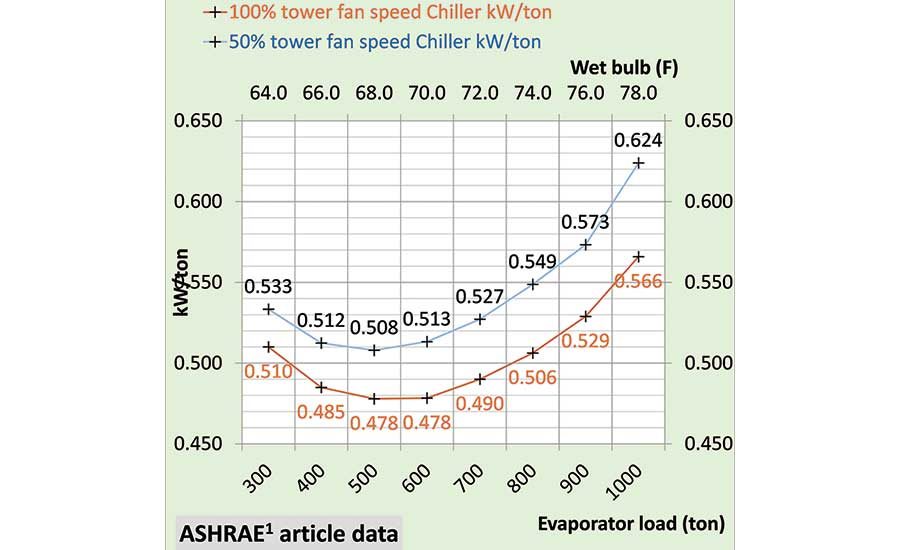 Figure 4. Chiller kW/ton data from Schwedler.
Figure 4 gives the chiller kW/ton for both 100% and 50% tower fan speeds as the evaporator load and wet bulb decrease. Chiller kW is significantly greater with 50% tower fan speed operation; however, the kW of the chiller plus tower fan is less with 50% tower fan speed as shown by Figure 5.
Figure 5 illustrates that the chiller kW increase with 50% tower fan speed, as shown by Figure 4, is less than the decrease in tower fan kW. The tower fan demand at 100% fan speed is 96 kW, and at 50% fan speed, the demand is 14 kW, an 82-kW decrease, which is greater than the chiller kW increase with 50% tower fan speed. The KC tower has a 4° approach to wet bulb.
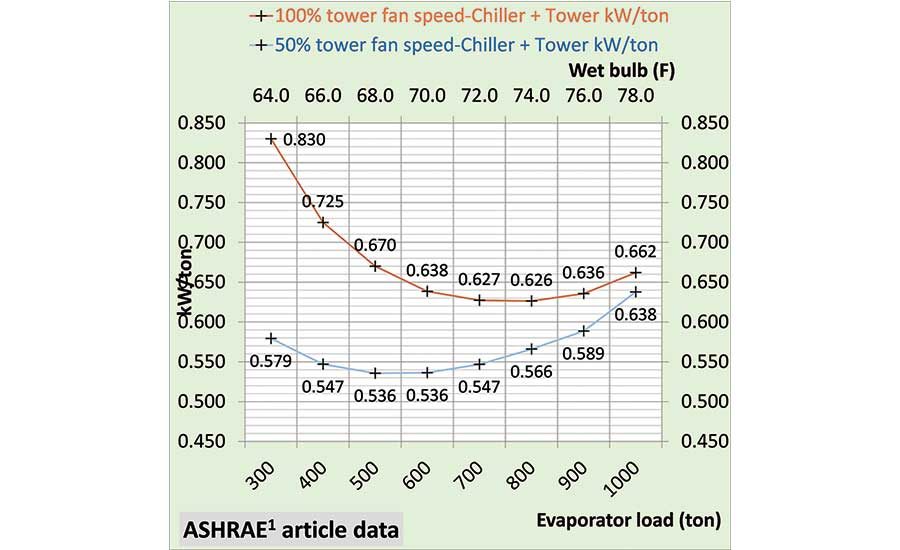 Figure 5. Chiller kW and tower kW.
The aforementioned figures illustrate the chiller/tower data provided by Schwedler. The data is incomplete in the sense that the chiller and tower cannot be modeled alone; the total plant must be modeled including the chiller/tower of the figures above but also including the chiller and condenser pumps and other characteristics of the plant. A complete chiller plant must be defined by a set of equations that are thermodynamically correct for all components of the plant that effect the performance of the plant, solved simultaneously by computer.
Chiller and Tower Manufacturer’s Selection Data
Table 1 gives the manufacturer’s chiller selection data for the No. 1 chiller as defined by Schwedler and chiller No. 1 of Table 1 of Part 1’s Trane data. The Trane chiller selection data will be addressed in detail in Part 3. Table 2 gives the performance data of the tower selected3 based on the Kansas City data of Schwedler. The data of Tables 1 and 2 was input into the SEE Plant Model.
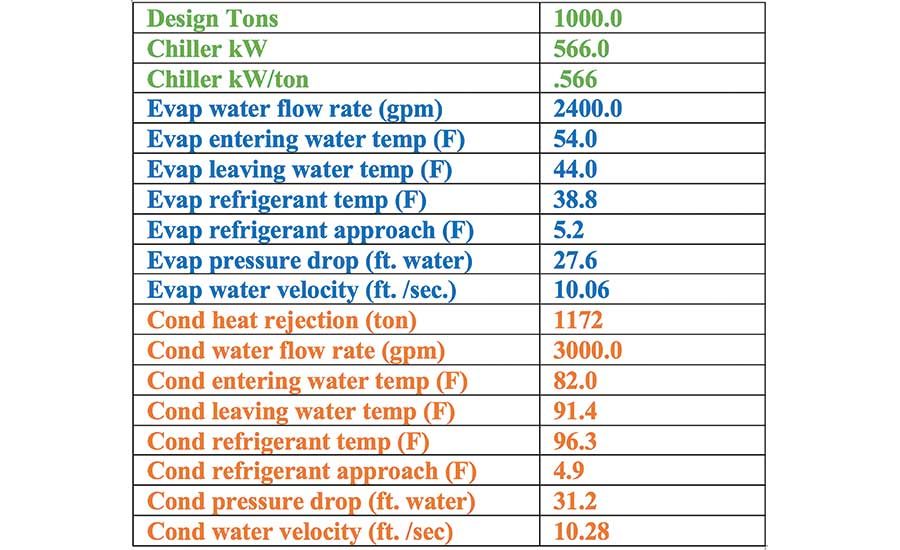 Table 1. Manufacturer’s chiller selection data.
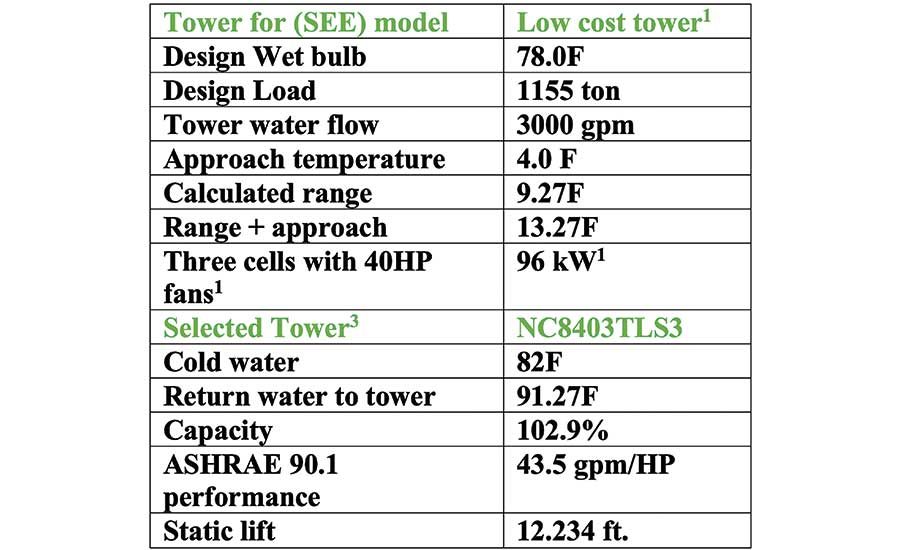 Table 2. The tower selected.
Schematics at Peak-Load Conditions
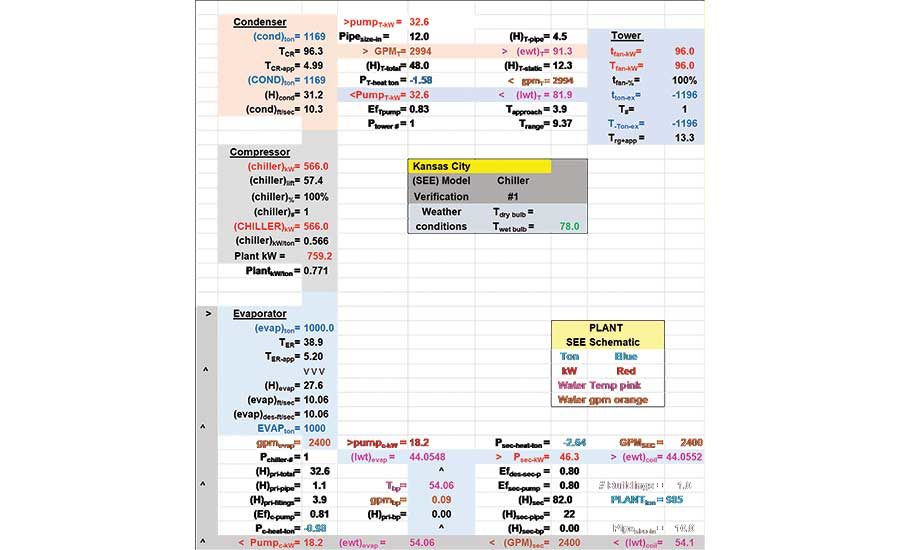
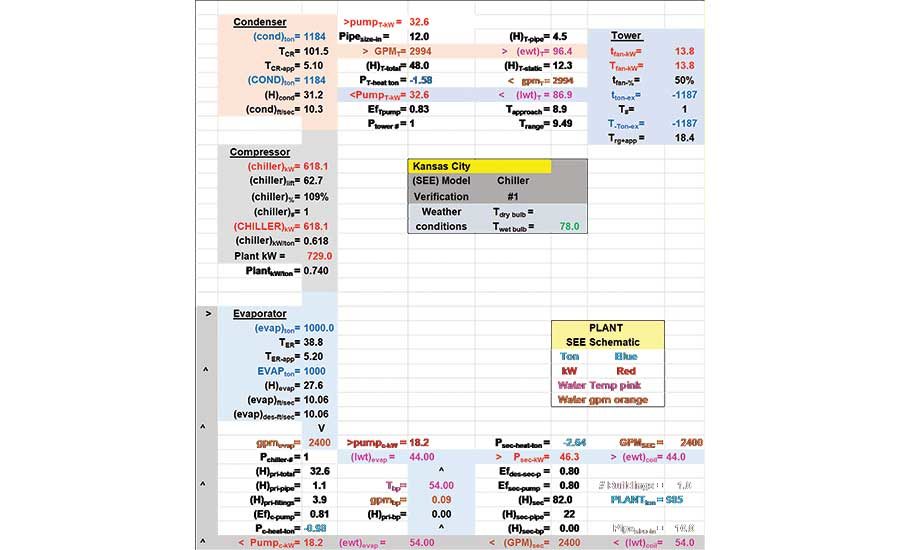
The SEE Plant Model includes plant schematics the author has found sometimes necessary to evaluate and understand plant performance. Schematic 1 is at peak 1,000-ton evaporator load, wet bulb 78°, and 100% tower fan speed, which is also shown on Table 3 at an evaporator load of 1,000 ton. Nomenclature at the end of this article defines values shown on the schematic. The Schwedler data does not include pumping.
Schematic 1 shows the chiller pump at 18.2 kW and the condenser pump at 32.6 kW. These are components introduced by the author to complete the plant. The bypass flow is slightly in the wrong direction at 0.09 gpm, a condition that will change with a sight change in load. The 0.09 gpm of 54.06° return water mixes with the 44.0548° supply water, resulting in a slight increase in water to the building coils at 44.0552°.
 Schematic 1. SEE Plant Model at 1,000-ton evaporator load and 100% tower fan speed.
The load from the building is 985 ton, requiring the chiller to operate at 100% capacity. As the load is passed through the plant, it increases to 1,196 ton exhausted by the tower. The tower approach at this load is 3.9° verses 4.0° design, and the range is 9.37° for a total approach plus range of 13.3°.
Schematic 1 is shown in Table 3 at a 1,000-ton evaporator load. Schematic 1 shows the plant load is 985 ton, and the primary/secondary (P/S) pumping adds heat to the system for an evaporator load of 1,000 ton. The chiller motor requires 566 kW to pump the refrigerant from the evaporator to the condenser and, in doing so, adds heat to the system; therefore, a 1,169-ton load at the condenser. The condenser load also includes the load due to the condenser pump. The tower exhausts 1,196 ton, which includes the tower fan heat. Thus, 985 ton has entered the plant and 1,196 ton has left.
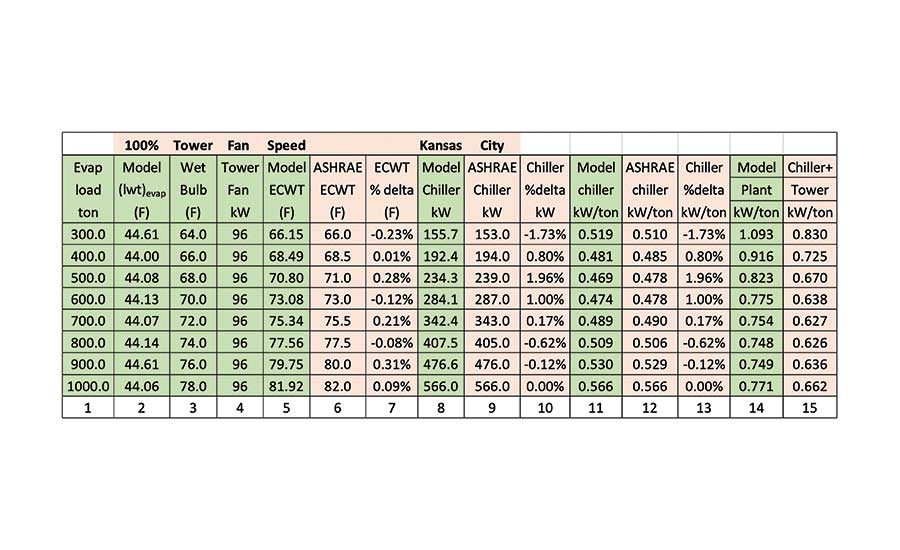 Table 3. Kansas City SEE Plant Model versus Schwedler data for 100% tower fan speed.
The total kW of the plant is 759.2 with the pumps and tower fan adding to the 566 kW of the chiller. Chiller lift6 is 57.4°, which is the difference between the condenser refrigerant temperature of 96.3° and the 38.9° evaporator refrigerant temperature.
Table 3 compares the values given by Schwedler to the values given by the SEE Model for 100% tower fan speed. Column 2 gives the model evaporator leaving water temperature that is controlled by column 8, the amount of kW applied to the chiller. Columns 5, 6, and 7 show the model entering condenser water temperature is within 1%. Columns 8, 9, and 10 show the model chiller kW is within 2% of the Schwedler values. Columns 14 and 15 illustrate a point made above; the Schwedler data is only for the chiller and tower, and the SEE Plant Model must include all components of a plant. Table 3 illustrates that the SEE Model compares best with the Schwedler data at design 1,000 ton. The greatest difference of 1.96% occurs at 500-ton evaporator load.
 Schematic 2. SEE Plant Model at 1,000-ton evaporator load, 50% tower fan speed.
Schematic 2, also in Table 4, is at peak 1,000-ton evaporator load and 78° wet bulb, but the tower fan speed is reduced to 50%. The only change made to the SEE Model in going from Schematic 1 to Schematic 2 is to lower the input to 50% tower fan speed and then adjust the chiller kW from 566 to 618.1 to get about 44° evaporator supply water. All other values on Schematics 1 and 2 are calculated by the model equations. Little changes occur at the evaporator side of the plant at 50% fan speed; the big change is in the performance of the tower, causing an increase in chiller lift and the necessary increase in the chiller kW to provide 44° supply water. Table 4 illustrates that the SEE Plant Model successfully transitions to 50% tower fan speed and gives a chiller kW value that is a maximum 2.15% of the Schwedler value with five values less than 1%.
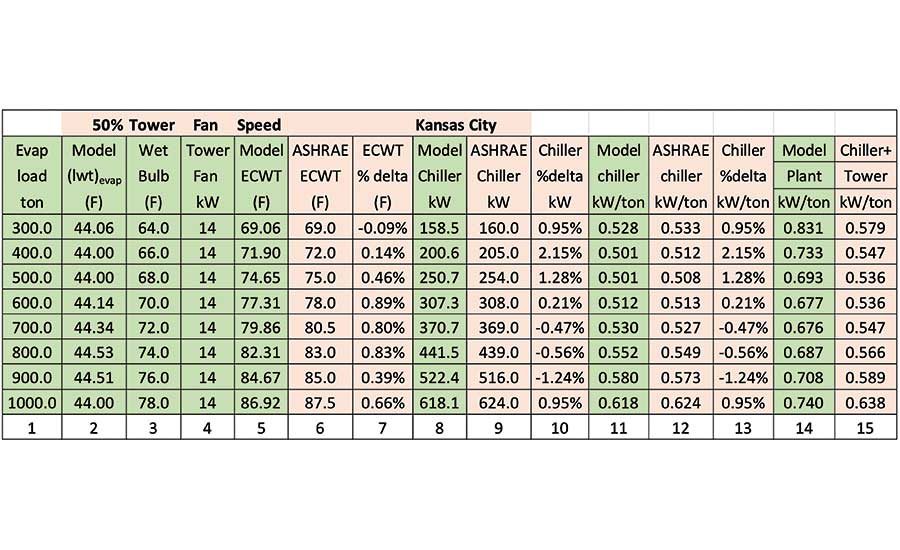 Table 4. Kansas City (SEE) Model versus Schwedler data for 50% tower fan speed.
As stated before, the only changes made in the SEE Model in going from Schematic 1 and Table 3 to Schematic 2 and Table 4 is the tower fan speed was reduced to 50% and chiller kW increased to supply 44° supply water. Table 4 compares the SEE Model result with the Schwedler data. The 1,000-ton evaporator load data is also on Schematic 2. Column 2 is the SEE Model water supply temperature that is close but normally not exactly 44° because to do so would require inputting the SEE Model chiller kW of column 8 to about the third place. Columns 8, 9, and 10 show that the model is within 2.15% of the Schwedler chiller kW data. Columns 14 and 15 illustrate the Schwedler kW data is only for the chiller and tower, and the model adds the chiller and condenser pumps.
SEE Model versus Data
Figures 6 and 7 are given to graphically show Table 3 and 4 data, illustrating how close the SEE Plant Model duplicates the chiller kW/ton and entering condenser water temperature (ECWT) for 100% and 50% tower fan speed.
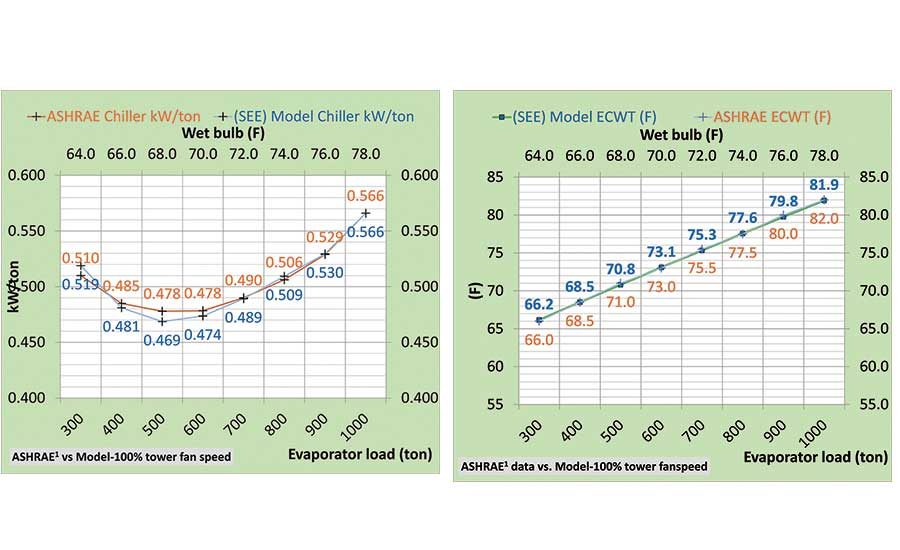 Figure 6. ASHRAE data versus SEE Plant Model at 100% tower fan speed.
Figures 6 and 7 show the chiller kW/ton decreases down to 500-ton evaporator load and then begins to increase to the load of 300 ton. This characteristic is duplicated by the SEE Plant Model for both 100% and 50% tower fan speeds; demonstrating the model’s validity.
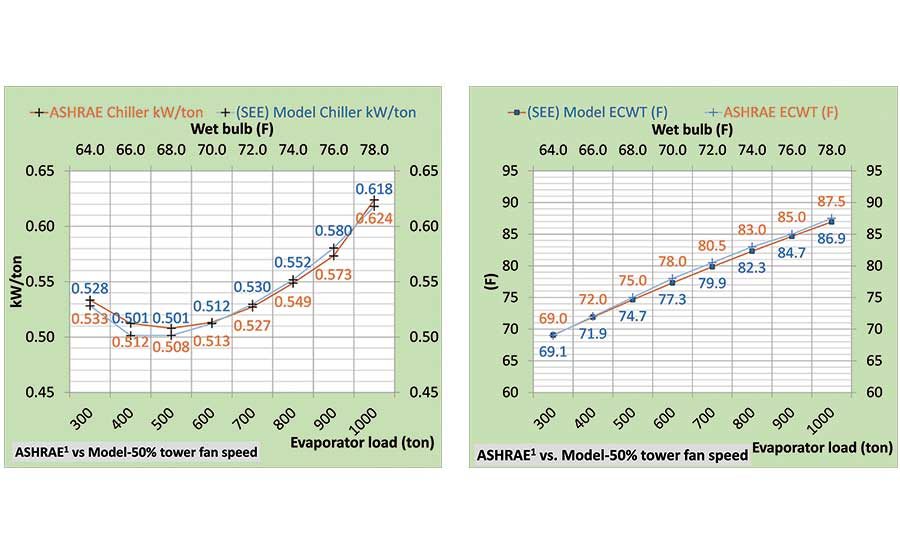 Figure 7. ASHRAE data versus SEE Plant Model at 50% tower fan speed.
SEE Model Verification
The schematics, tables, and figures referenced in this article have shown the SEE Model duplicates the performance of the chiller/tower data given by Schwedler.
The subsequent charts will give SEE Model data that was necessary to accomplish a complete model of a chiller plant. The following will include P/S pumping, chiller, and tower performance and demonstrate energy into the plant equals energy out of the plant.
Plant Performance
The following will give SEE Model plant performance data, which Schwedler did not provide but is part of a chiller plant and therefore a necessary part of a chiller plant computer simulation as illustrated by Schematics 1 and 2. As shown by the schematics, the plant load is less than the evaporator load because the P/S pumping kW of the plant adds load to the evaporator. Also, the schematics illustrate that the P/S pumping and evaporator performance is not affected by operating the tower at 100% versus 50% tower fan speed. Therefore, the following charts of P/S pumping and the evaporator performance will only be given for 100% tower fan speed.
Figure 8 gives the P/S pumping water flow (gpm) and pump kW demand as the evaporator load and wet bulb decrease. The secondary pumping flow decreases as the load decreases and, therefore, the secondary pump kW decreases. The chiller pump flow is a constant 2,400 gpm, and the pump electrical demand is a near-constant 18.3 kW, changing slightly due to bypass flow. The secondary flow is the evaporator flow minus the bypass flow. The bypass flow is very close to zero at peak 1,000-ton evaporator load. Schematic 1 shows a very small 0.09 gpm bypass flow in the wrong direction that increases the temperature of water from the evaporator from 44.0548° to 44.0552° as the water enters the building coils. Supply water from the evaporator is given by the primary horizontal axis of Figure 8 as close to 44°. To get exactly 44° supply water would require fine-tuning the SEE Model chiller kW input, i.e., the water supply temperature is very sensitive to the chiller kW.
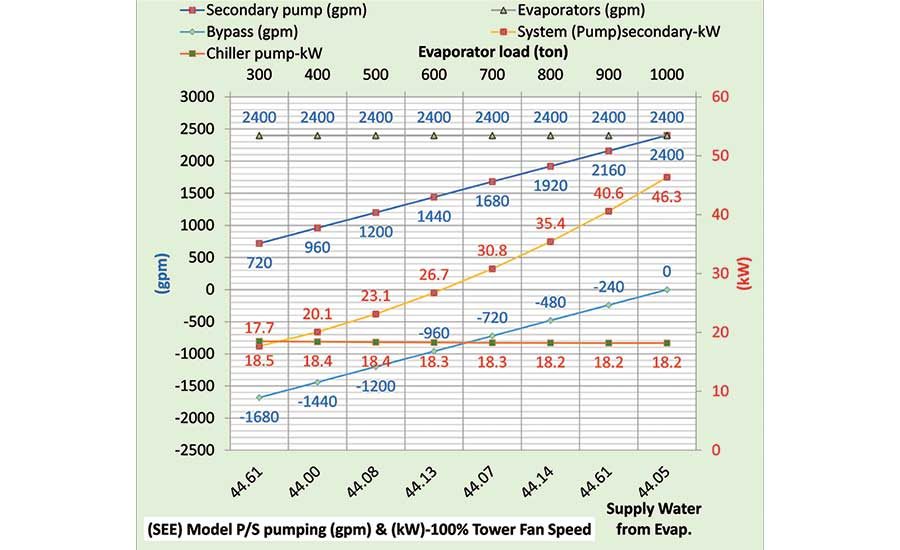 Figure 8. Primary/secondary pumping.
Figure 9 gives the P/S water temperatures. The evaporator leaving water is about 44° as is the bypass water temperature except at peak 1,000-ton evaporator load, where bypass flow is in the wrong direction and is therefore equal to the coil leaving water temperature of 54.06°. The coil leaving water temperature is about 54°, but the water entering the evaporator is mixed with the bypass water and therefore decreases to 47.61° at 300-ton evaporator load.
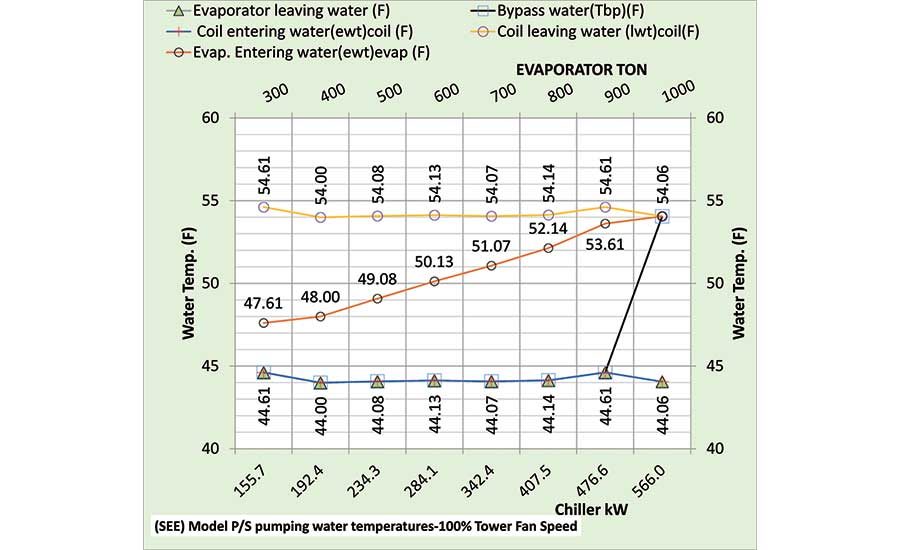 Figure 9. Primary/secondary water temperatures.
Tower Performance
Table 2 defines the selected tower input to the SEE Model. Figure 10 illustrates a significant drop in tower performance with 50% tower fan speed. Tower range changes little, but tower approach significantly increases with 50% tower fan speed, resulting in an increase in chiller lift as shown by Figure 11 and therefore an increase in chiller kW, also shown by Figure 11.
.jpg?1596119186=&width=900&height=550) Table 2. The tower selected.
Table 2. The tower selected.
Figure 10 illustrates that the tower approach to wet bulb decreases for both 100% and 50% tower fan speed as wet bulb and tower load drop. At 1,000 ton and 78° wet bulb, the 50% fan speed increased the approach from 3.92° to 8.92°, a 5° increase. The performance of the chiller/tower as a unit is illustrated by the tower load (secondary axis) that is a function of chiller kW, and chiller kW is a function of chiller lift that is a function of condenser leaving water temperature that essentially sets the condenser refrigerant temperature. The SEE Model tower performance of Figure 10 is consistent with the tower manufacturer’s data.
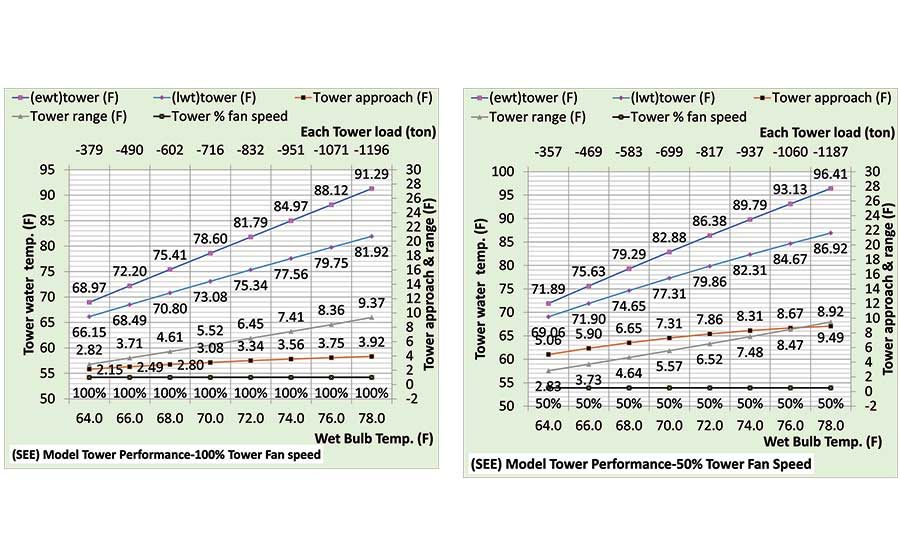
Figure 10. Tower performance for 100% and 50% tower fan speed.
Chiller Lift
Chiller lift is the difference in the refrigerant temperatures of the condenser minus the evaporator refrigerant temperature6 as shown by Figure 12. The evaporator refrigerant temperature is largely set by the evaporator water supply temperature and therefore varies little compared to the condenser refrigerant temperature as shown by Figure 12. Figure 10 illustrates how the tower entering water temperature varies with load and wet bulb temperature. Tower entering water temperature is also the condenser leaving water temperature, which, in large part, sets the condenser refrigerant temperature shown by Figure 12. Condenser refrigerate temperature equals the condenser leaving water temperature plus the condenser refrigerant approach temperature where condenser refrigerant approach temperature is a chiller design/selection and cost issue. Part 3 will cover chiller cost as a function of refrigerant approach temperature.
Figure 11 illustrates how the chiller kW drops with chiller lift as evaporator load and wet blub drops for both 100% and 50% tower fan speeds.
 Figure 11. Chiller kW and chiller lift.
Figure 12 gives the refrigerant temperatures and chiller lift for both 100% and 50% tower fan speeds. Tower fan speed at 50% versus 100% increases the tower entering water temperature and, therefore, the condenser refrigerant temperature results in an increased chiller kW as shown by Figure 11 and also the secondary horizontal axis of Figure 12.
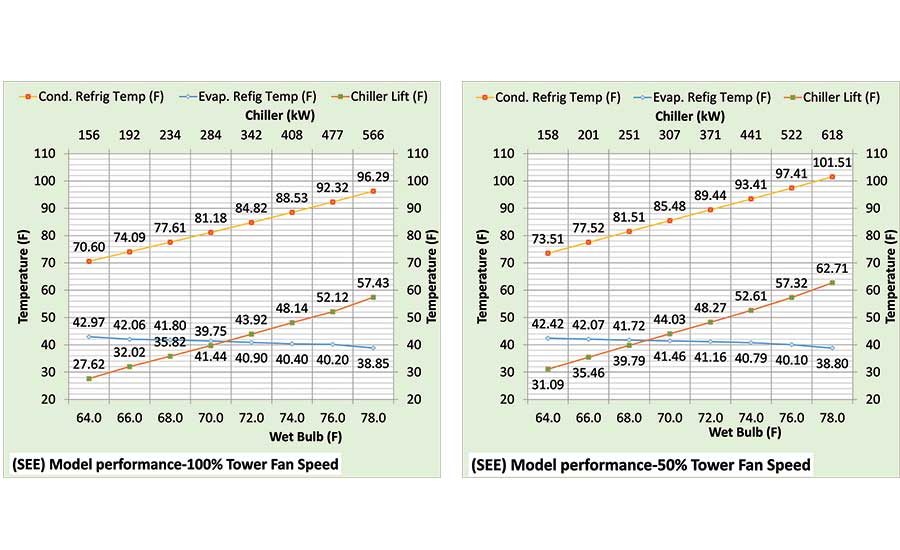 Figure 12. Chiller lift.
Controlling chiller kW is basically a task of controlling chiller lift — the greater the chiller lift, the greater the chiller kW. Increasing evaporator water supply temperature decreases lift, and, therefore, chiller kW. Part 3 will show how decreasing the condenser and evaporator refrigerant approach temperatures decreases chiller lift and, therefore, chiller kW but increases chiller cost.
The task for the chiller plant designer is not to just decrease chiller kW but to decrease the plant kW. The tower kW and pump kW must be considered, where pumping kW is a function of condenser and evaporator pressure drop. Generally, the pressure drop of the condenser and evaporator increases as the refrigerant approach temperature decreases. A SEE Plant Model can address these issues, as shown in Parts 3 and 4.
Figure 13’s top chart compared to the bottom chart illustrates the increase in chiller (kW/evaporator ton) with 50% tower fan speed. The secondary horizontal axis of both charts illustrates the increase in percentage of chiller kW with 50% tower fan speed. However, the (plant kW/plant ton) is less with 50% tower fan speed. Schematics 1 and 2 also illustrate that plant kW is less with 50% tower fan speed at 1,000-ton evaporator load. The plant kW/ton decreases with 50% tower fan speed because the chiller kW increase is less than the tower fan kW decrease. This condition is driven by the selection of a 4° approach tower with a necessary relatively high tower fan kW of 96.
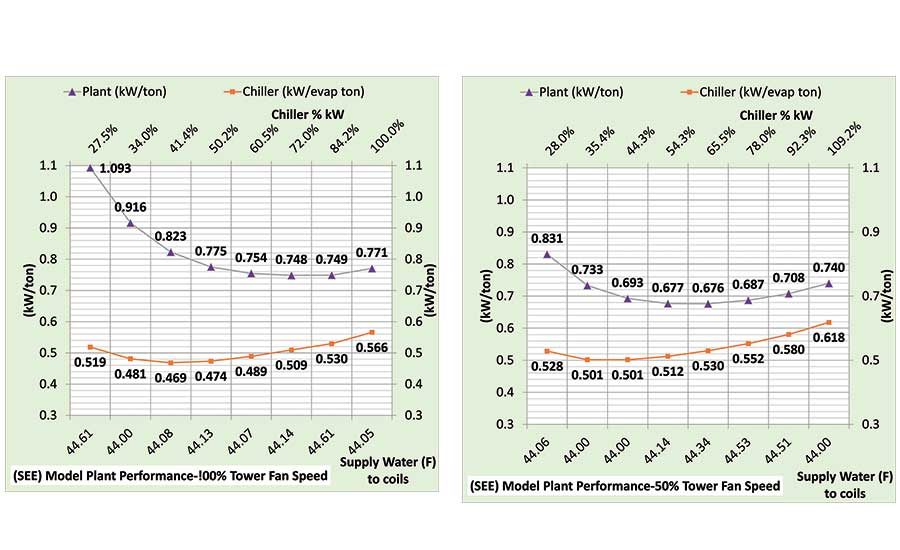
Figure 13. SEE Model plant performance at 100% and 50% tower fan speeds.
Figure 14 gives the kW demand of the plant components illustrating the dominance of the chiller kW. Chiller kW significantly increases with 50% tower fan speed, but the drop in tower fan kW (96 kW - 14 kW = 82 kW) is consistently greater than the increase in chiller kW as shown by Figure 14.

Figure 14. SEE Model plant performanceat 100% and 50% tower fan speeds.
Energy In Equals Energy Out
Energy in = energy out is a fundamental requirement of the SEE Model. The following figures illustrate compliance with this basic thermodynamic requirement.4&5
The top chart of Figure 15 gives the pumps and tower fan energy in ton, which is also on the bottom chart but is difficult to read. The plant load is the big energy-in component, and the tower exhaust is the total energy out; all energy into the system is exhausted by the tower. The pump energy into the system is modeled as equal to the efficiency of the pump with the remaining heat energy transferred to the atmosphere. As evaporator load and wet bulb decrease, only two plant components change their energy into the system: the secondary pump and the chiller, as shown by Figure 15. Figure 16 shows that energy into and out of the plant reduces with 50% tower fan speed.
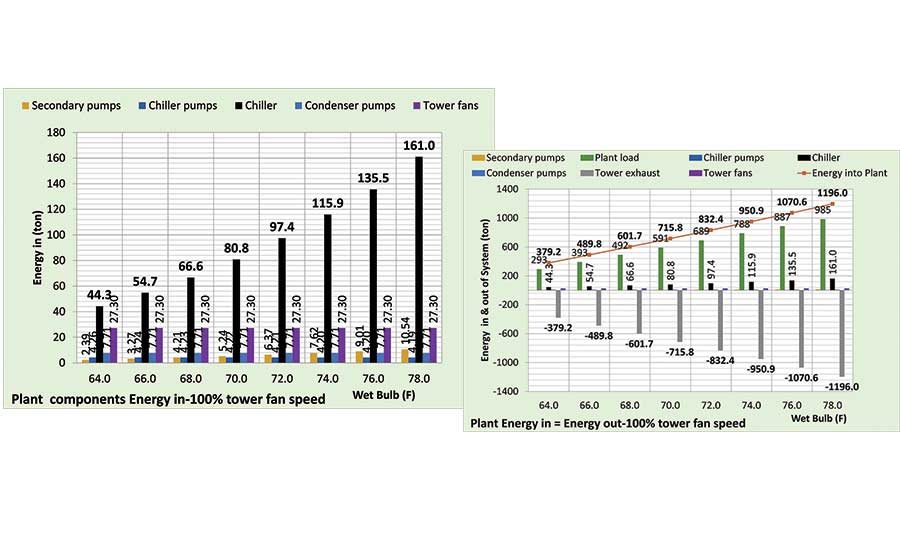 Figure 15. Energy in = energy out at 100% tower fan speed.
Figure 16 gives energy in = energy out for 50% tower fan speed, illustrating the smaller values for 50% tower fan speed because the chiller kW plus tower fan kW is less with 50% tower fan speed.
 Figure 16. Energy in = energy out at 50% tower fan speed.
Conclusions
Several papers have expressed the need for accurate building and plant models including a 2016 ASHRAE article8 titled, “Modeling Performance Isn’t Actual Performance.” The author has presented several articles9&10 on modeling, and this paper is an attempt to further the understanding of SEE Modeling and establish the validity of the model by illustrating both the challenge and the ability of the SEE Plant Model to duplicate manufacturer’s data.
Parts 3 and 4 of this series will continue to demonstrate the SEE Model’s ability to duplicate manufacturers’ data and also deal with basics of chiller plant design.
References
1.Schwedler, Mick. July 1998 “Take It to The Limit…Or Just Halfway?” ASHRAE Journal.
2.Trane chiller selection data received by Kirby Nelson from the Springfield, Missouri, Trane office.
3.SPX Cooling Technologies (Marley). UPDATED Version
4.“Introduction to Thermodynamics and Heat Transfer.” 1956 Prentice-Hall, Inc. by David A. Mooney.
5.“Thermal Environmental Engineering,” third edition. 1998 Prentice-Hall Inc. by Thomas H. Kuehn, Chapter 3.
6.2012 ASHRAE Handbook, “HVAC Systems and Equipment,” Page 43.10, Figure 11, “Temperature Relations in a Typical Centrifugal Liquid Chiller.”
7.Mark Baker, Dan Roe, Mick Schwedler. ASHRAE Journal June 2006. “Prescription for Chiller Plants.”
8.ASHRAE Journal May 2016. “Modeled Performance Isn’t Actual Performance.”
9.Nelson, K. “Simulation Modeling of a Central Chiller Plant,” CH-12-002. ASHRAE 2012 Chicago Winter Transactions.
10. Nelson, Kirby. July 2010, “Central-Chiller-Plant Modeling,” HPAC Engineering.
11.Nelson, K. System Energy Equilibrium (SEE) Building Energy Model. http://kirbynelsonpe.com/
Nomenclature
CENTRAL PLANT
# Buildings = number of buildings served by plant
Plant ton = total load (ton) to plant
Primary/secondary pumping nomenclature
gpmevap = total gpm flow thru one evaporators
(H)pri-total = total primary pump head (ft) = (H)pri-pipe + (H)pri-fittings + (H)pri-bp + (H)evap
(H)pri-pipe = primary pump head due to piping (ft)
(H)pri-fittings = primary head due to pump & fitting (ft)
(Ef)c-pump = efficiency of chiller pump
Pc-heat-ton = chiller pump heat to atmosphere (ton)
Pc-kW = one chiller pump kW demand (kW)
Pchiller-# = number chiller pumps operating
(lwt)evap = temperature water leaving evaporator (F)
Tbp = temperature of water in bypass (F)
gpmbp = gpm water flow in bypass
(H)pri-bp = head if chiller pump flow in bypass (ft)
(ewt)evap = temp water entering evaporator (F)
Psec-heat-ton = secondary pump heat to atmosphere (ton)
Psec-kW = kW demand of secondary pumps
Efdes-sec-p = design efficiency of secondary pumping
Efsec-pump = efficiency of secondary pumping
(H)sec = secondary pump head (ft) = (H)sec-pipe + (H)sec-bp + (H)coil + (H)valve
(H)sec-pipe = secondary pump head due to pipe (ft)
(H)sec-bp = head in bypass if gpmsec > gpmevap
GPMsec = water gpm flow in secondary loop
(ewt)coil = water temperature entering coil (F)
Pipesize-in = secondary pipe size (inches)
(lwt)coil = temperature of water leaving coil (F)
Evaporator
(evap)ton = load (ton) on one evaporator
TER = evaporator refrigerant temp (F)
TER-app = evaporator refrigerant approach (F)
EVAPton = total evaporator loads (ton)
(H)evap = pump head thru evaporator (ft)
(evap)ft/sec = velocity water flow thru evaporator
(evap)des-ft/sec = evaporator design flow velocity
Compressor:
(chiller)kW = each chiller kW demand
(chiller)lift = (TCR – TER) = chiller lift (F)
(chiller)% = percent chiller motor is loaded
(chiller)# = number chillers operating
(CHILLER)kW = total plant chiller kW
(chiller)kW/ton = chiller kW per evaporator ton
Plant kW = total kW demand of plant
(Plant)kW/site ton = Plant kW per site ton
Condenser nomenclature:
(cond)ton = load (ton) on one condenser
TCR = temperature of condenser refrigerant (F)
TCR-app = refrigerant approach temperature (F)
(COND)ton = total load (ton) on all condensers
(H)cond = tower pump head thru condenser (ft)
(cond)ft/sec = tower water flow thru condenser
Tower piping nomenclature
Pipesize-in = tower pipe size (inches)
gpmT = each tower water flow (gpm)
GPMT = total tower water flow (gpm)
(H)T-total = total tower pump head (ft)
PT-heat = pump heat to atmosphere (ton)
PT-kW = each tower pump kW demand
EfT-pump = tower pump efficiency
Ptower # = number of tower pumps
(H)T-pipe = total tower pump head (ft)
(ewt)T = tower entering water temperature (F)
(H)T-static = tower height static head (ft)
Trange = tower range (F)= (ewt)T – (lwt)T
(lwt)T = tower leaving water temperature (F)
Tapproach = (lwt)T – (Twet-bulb)
Tower nomenclature
tfan-kW = kW demand of one tower fan
Tfan-kW = tower fan kW of fans on
tfan-% = percent tower fan speed
tton-ex = ton exhaust by one tower
T# = number of towers on
Tton-ex = ton exhaust by all towers on Trg+app = tower range + approach (F)


