


While scientists continue to investigate the theory that SARS-CoV-2, the virus behind the COVID-19 disease, can be transmitted through HVAC systems, ASHRAE has stated that the “Transmission of SARS-CoV-2 through the air is sufficiently likely that airborne exposure to the virus should be controlled.”1
The latest commercial guide from ASHRAE’s Epidemic Task Force recommends different strategies to mitigate any airborne transmission of SARS-CoV-2 including the use of mechanical filtration, ultraviolet germicidal irradiation (UVGI), humidity control, and dilution through increased outdoor air (OA) ventilation.2 Some of these strategies lead to the same outcome but at widely varying costs.
This paper analyzes the relative efficiency and cost of various OA ventilation and filtration approaches to reduce the risk of airborne transmission of SARS-CoV-2 through bioaerosols in commercial buildings.3 Bioaerosols are airborne particles smaller than 5 microns that contain viruses. The cost/benefit risk model presented in this paper can be used by HVAC engineers and building owners to best design cost-effective HVAC systems that reduce the potential airborne transmission of SARS-CoV-2 in commercial buildings.
How viruses spread through HVAC systems in commercial buildings
The airborne transmission of viruses can occur through bioaerosols, which are particles smaller than 5 microns that contain viruses. When an infected person coughs or sneezes, small drops of mucus containing the viruses are formed. Most of these droplets are bigger than 5 microns and settle on surfaces, where the virus may remain viable for two to three days. However, smaller droplets (< 5 microns), also called bioaerosols, can stay airborne and potentially travel through HVAC systems. These bioaerosols — although very small — are typically much larger than an individual virus particle, which is key to stopping their propagation.
How bioaerosols can be removed from indoor air
There are two main approaches to remove bioaerosols from indoor air:
Filtration — Bioaerosols can be removed from the air through the use of filters. The higher the efficiency of the filter, the higher the percentage of bioaerosol removal from filtered air. This filtration efficiency is defined by MERV, which is an ASHRAE-created standard that evaluates filter efficiency for three particle size ranges: 0.3-1 micron, 1-3 microns, and 3-10 microns.4 Based on numerous studies measuring the size distribution of influenza bioaerosols, it has been concluded that 20% of flu bioaerosols are at the 0.3-1 micron range, 29% at the 1-3 micron range, and 51% at the 3-10 micron range5. Based on this finding and on the MERV table from ASHRAE Standard 52.26, a size-weighted filtration efficiency for different MERVs7 shows that MERV-7 filters (along with MERV 8, commonly used in commercial buildings) achieve a 42.2% average efficiency in filtering bioaerosols, while MERV-13 filters achieve an 85.9% efficiency for particles ranging from 0.3-10 microns. It has been estimated that the typical size range of bioaerosols containing viruses is 0.3-5 microns.
MERV 13 or higher filters should be used in the design of HVAC systems to achieve 85.9% removal efficiency for virus-carrying particles, which typically range from 0.3-10 microns.8
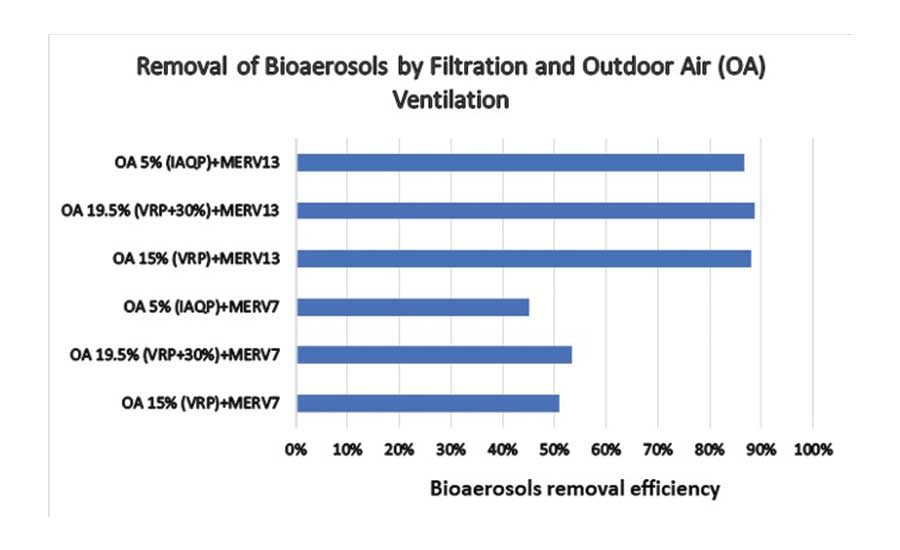
Ventilation — Bioaerosols can also be removed from the air through air exchanges, which is to say by diluting indoor air with outside air (OA). The rate of bioaerosol dilution is correlated with the percentage of OA relative to recirculated air. For example, with 15% OA (typical under ASHRAE 62.1 Ventilation Rate Procedure (VRP), about 15% of the bioaerosols will be removed from the indoor air. If OA is increased by 30% (VRP + 30%), then approximately 19.5% of the bioaerosols will be removed. This is a very small relative efficiency gain compared to filtration, and increasing OA comes at a much higher cost in terms of upsizing HVAC equipment and consuming more energy during building operation.
The relative benefits of removing bioaerosols from indoor air via filtration and ventilation are shown in the chart that follows. The chart is based on calculations for buildings with central VAV (Variable Air Volume) systems with mixed outside and return air and assumes that 100% of bioaerosol removal (dilution) is achieved for the fraction of OA. Filtration efficiency is applied to the remaining fraction of recirculating air (total supply minus outside air) based on the corresponding MERV efficiency. For example, VRP + 30% + MERV 13 results in 19.5% of total supply comprising OA with 100% efficiency of bioaerosol removal and the remaining 80.5% supply air comprising return air with 86% efficiency of bioaerosol removal.
Figure 1 shows that filtration is much more effective at removing bioaerosols from indoor air than ventilation, and that any ventilation strategy, including IAQP, using MERV 13 or better will remove almost 90% of bioaerosols from indoor air.
Multiple studies have confirmed the superiority of filtration over increased ventilation at reducing transmission risk of airborne viruses. For example, a 2013 paper on strategies to reduce the spread of airborne infectious agents in health care facilities found that, “Various filtration systems can provide significant protection over contaminant dispersion.”9
Based on the relative benefits of filtration compared to ventilation, it should not be surprising that the relative risk of contracting COVID-19 in a commercial building has more to do with filtration strategies than ventilation strategies. This relative risk can be determined quantitatively using the Wells-Riley equation.10&11 Developed in the 1970s, the Wells-Riley equation is the most common approach for assessing risk of infection to humans in buildings, taking into account parameters such as the size of the building, number of people in the building, number of infected people, and the amount of time infected people spend in the building.
We applied the Wells-Riley equation to a typical 100,000-square-foot office space with 1,000 people including seven people infected with COVID-19 to show the relative risk of infection using different ventilation and filtration approaches.12 The results, summarized in Figure 2, confirm very little additional benefit from increased ventilation when higher MERV filtration is used.
With improved filtration (MERV 13 or higher), increasing ventilation provides a negligible contribution to the removal of bioaerosols from indoor air. Therefore, we recommend designing for high filtration and ventilating based on ASHRAE 62.1 IAQP to save energy and money that can be used to offset the cost of improved filtration.
Modeling the cost-benefit of VRP vs. IAQP ventilation approaches with different filtration efficiencies
At the end of the day, building owners and HVAC engineers need to balance risks with costs. Often this tradeoff requires spending more money to reduce risk. In the case of choosing ventilation vs. filtration to reduce the risk of airborne transmission of viruses, such a tradeoff is not necessary.
Using the same Wells-Riley equation, we calculated the cost-benefit of OA ventilation using VRP vs. IAQP + sorbent-based air cleaning with different levels of filtration efficiency. The modeling results for New York City are displayed in the following chart, which shows that VRP ventilation (blue line) increases life cycle costs significantly compared to IAQP + sorbent based air cleaning (green line) without delivering a meaningful reduction in the relative risk of airborne transmission.13 This is because implementing higher levels of filtration is much less costly than upsizing HVAC systems and increasing energy consumption to accommodate additional OA. The first cost and operating costs of using filtration and IAQP for OA ventilation are almost $500,000 less than the equivalent (in terms of bioaerosol removal) level of VRP OA ventilation.
Figure 3 shows the same relative risk of airborne transmission can be achieved with improved filtration and reduced ventilation when ASHRAE’s 62.1 IAQP is used with sorbent-based air cleaning technology. Using this approach, savings from reduced ventilation can offset the cost of increasing filtration.
The results of the model for Toronto and Washington, D.C., are shown in Figure 3 Results vary between cities, but the IAQP approach offers superior cost and benefit even in markets with less extreme climates or lower energy costs.
Additional shortcomings of increasing ventilation to mitigate the airborne transmission of viruses
Beyond the negligible contribution of increased ventilation to the removal of bioaerosols with improved filtration, increasing ventilation may actually be counterproductive to reducing the risk of transmission of viruses, such as SARS-CoV-2 for the following reasons:
Humidity Control — Many studies have shown that relative humidity (RH) of 40%-60% inhibits the spread of viruses. In the winter, increasing OA introduces dry air into the building that can lead to RH dropping below 40%, leading to more airborne bioaerosols. In the summer, large volumes of humid OA can increase indoor RH above 60%, causing the same problem. Recently, a group of scientists including experts from Harvard and Yale launched a petition calling on the World Health Organization (WHO) to review the extensive research showing that indoor humidity levels between 40%-60% RH are optimal for inhibiting the spread of respiratory viruses and recommending WHO set a minimum lower limit for indoor humidity in public buildings.14 Reducing OA using ASHRAE 62.1 IAQP can improve humidity control in buildings by reducing the introduction of humid air in the summer and dry air in the winter.
Pollution Control — A growing number of pre-print studies are examining a possible link between pollution and both the spread and impact of respiratory viruses on people who are infected.15 Best understood is the link between compromised hearts and lungs due to pollution and higher death rates from viruses like SARS-CoV-2. For example, a recent Harvard study shows that a small increase in long-term exposure to PM2.5 (particulate matter measuring 2.5 microns or smaller) leads to a large increase in the COVID-19 death rate.16 Studies also show that pollutants inflame lungs, potentially making catching the virus more likely and its impacts more serious. Several recent studies also show that particles of pollution might carry the virus, thereby facilitating its spread. For example, a recent study from Italy found a correlation between elevated concentration of PM and the high spread and mortality rate of SARS-CoV-2.17
Based on these studies, building owners and HVAC engineers should consider pollution levels before increasing ventilation, as a higher intake of particulate matter could facilitate the spread of viruses and make building occupants more susceptible to the impacts of viruses.
While scientists continue to investigate the possibility that SARS-CoV-2 can be transmitted through HVAC systems, MEPs and HVAC engineers should design new mechanical systems with robust filtration (MERV 13 or higher for commercial buildings) to minimize the risk of airborne transmission of SARS-CoV-2. Increasing ventilation in addition to improved filtration does not materially reduce the risk of airborne transmission of viruses and adds significant cost. In fact, increasing ventilation may actually be counterproductive to reducing the risk of airborne transmission of viruses such as SARS-CoV-2 due to challenges controlling humidity and outside pollution with higher OA. The best strategy is to design for improved filtration and use ASHRAE’s Indoor Air Quality Procedure (IAQP) with sorbent-based air cleaning to reduce OA requirements and offset the cost of improved filtration.
3 This paper includes examples for office buildings, but the results will be similar for any commercial building application except patient wards for hospitals, for which additional strategies outside the scope of this paper should be considered.
4 MERV 17-20 filters are often referred to as HEPA filters. HEPA stands for High Efficiency Particulate Air filters.
5 Azimi, P. and Stephens, B. (2013) HVAC filtration for controlling infectious airborne disease transmission in indoor environments: predicting risk reductions and operational costs, Build. Environ., 70, pg. 8
6 https://www.techstreet.com/ashrae/standards/ashrae-52-2-2017?product_id=1942059
7 Azimi, P. and Stephens, B. (2013) HVAC filtration for controlling infectious airborne disease transmission in indoor environments: predicting risk reductions and operational costs, Build. Environ., 70, pg. 11
8 The latest commercial guide from ASHRAE’s Epidemic Task Force dated April 20, 2020 recommends a minimum of MERV 13 or the highest compatible with the filter rack and seal edges of the filter to limit bypass.
9 Steve Emmerich, David Heinzerling, Jung-il Choi, (2013) Andrew Persily Multizone Modeling of Strategies to Reduce the Spread of Airborne Infectious Agents in Healthcare Facilities. Building and Environment February 2013; Volume 60; 105-115
10 Wells WF. On the mechanics of droplet nuclei infection.1. apparatus for the quantitative study of droplet nuclei infection of animals. Am J Hyg 1948;47:1-10
11 Riley EC, Murphy G, Riley RL. Airborne spread of measles in a suburban elementary-school. Am J Epidemiol 1978;107:421-32
12 Supplemental information about the model, calculations and assumptions is available in the Appendices
13 Costs include HVAC equipment, sorbent-based air cleaning equipment (HLR), annual filters and HLR annual service and electricity consumption (more information about the model, methodology, calculations, and assumption is available in the Appendices)
16 https://projects.iq.harvard.edu/covid-pm/home
17 https://www.ncbi.nlm.nih.gov/pmc/articles/PMC7156797/#CR6
Appendix A – Notes Analysis Methodology
enVerid used the Wells-Riley approach to assess risk of infection for SARS-CoV-2. The Wells-Riley Risk Approach allows the modelling of risk of infection as a function of building operational parameters. enVerid referred to “HVAC filtration and the Wells-Riley approach to assessing risks of infectious airborne diseases” (Stephens, 2012) as a basis for the risk assessments conducted as a part of this paper.
A.1 Defining Risk “Risk of infection” in these calculations is defined as the risk of an individual becoming infected because of their exposure to the building. Risk of infection can be calculated using the Wells-Riley approach via the following formula.
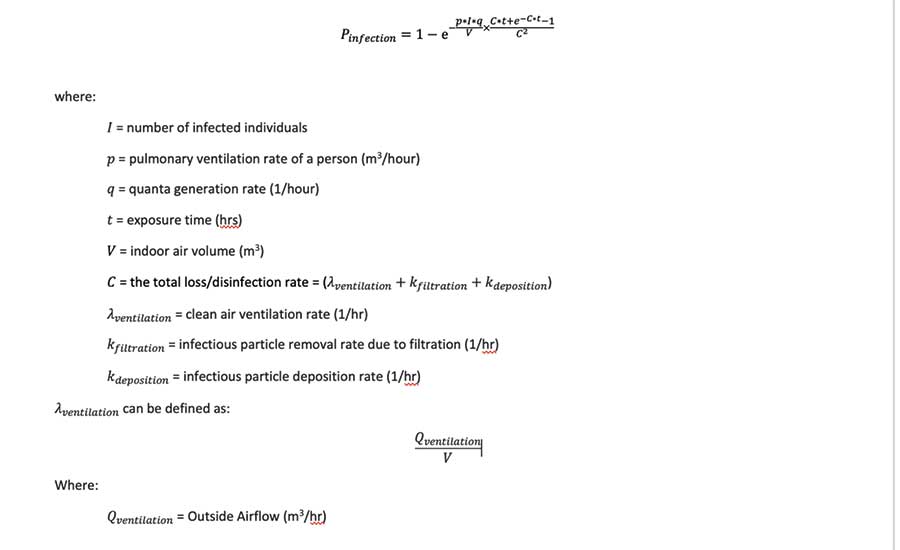
Figure 6. Risk of infection can be calculated using the Wells-Riley approach via this formula.
A.2 Assumptions and Theoretical Building Parameters
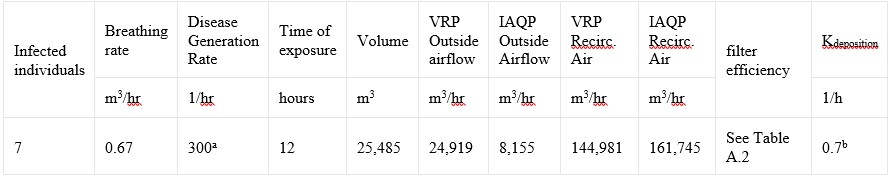
Table 1. Assumptions and theoretical building parameters. a - The disease generation rate used as a part of these calculations is consistent with early research of the SARS-CoV-2 disease generation rate. b - enVerid referenced the calculated value for Kdeposition from (Stephens, 2012).
As a part of these calculations enVerid used the inputs in Table 2, which shows the filter efficiencies enVerid referenced as a part of these calculations.
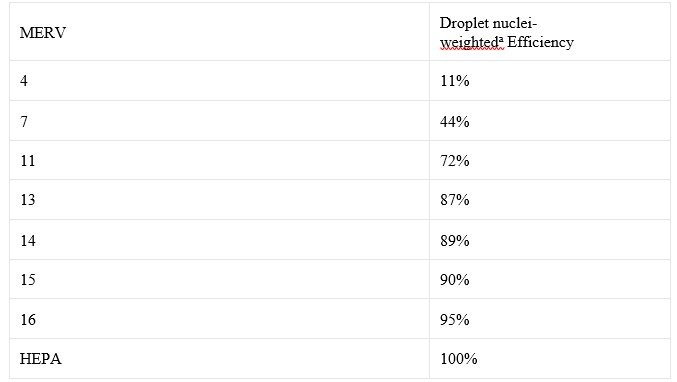
Table 2. Filter efficiencies (Stephens, 2012). a - assuming 15% are 0.3-1 μm, 25% are 1-3 μm, and 60% are 3-10 μm.
Appendix B – Life-Cycle Cost Analysis Methodology
Reducing outside air in a system provides two different forms of savings. The first of these is capital expenditure savings; by reducing outside air, the peak design heating and cooling load are reduced, and equipment can be downsized. The second of these is operating expenditure savings by reducing outside air, the amount of energy required to bring that outside air to the supply air temperature is reduced. By utilizing HLR modules reductions in outside air can be achieved and both first-cost savings and operational savings can be achieved. Adding filters to a system does result in a reduction of risk of infection due to airborne pathogens, but it comes with an associated upfront cost and operational cost.
B.1 Operational Expenditure Calculation Methodology
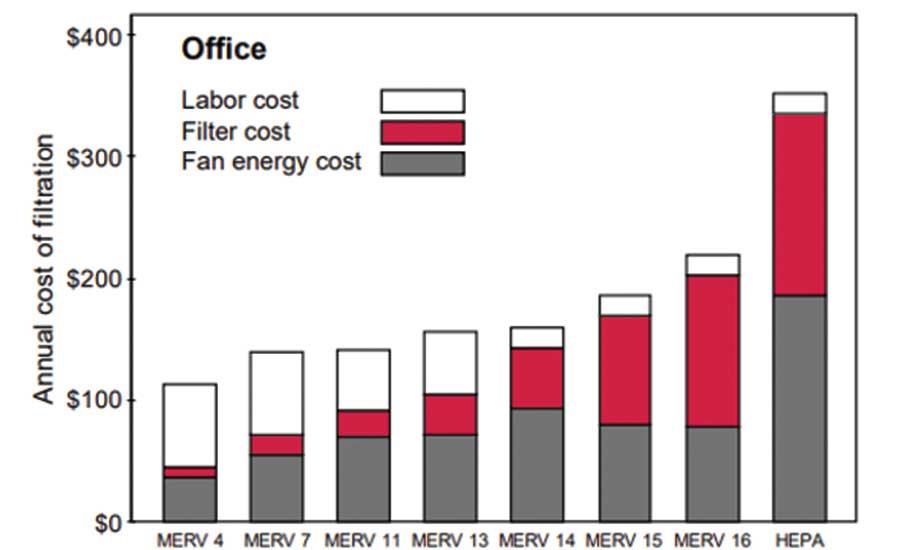
Figure 7. Annual filter costs per filter for office buildings.
B1.1 Filter Operational Costs As a part of Stephens, 2012, annual costs for filtration were compiled per filter type. enVerid referenced the same cost information used as a part of that study to calculate filter life cycle cost. The study considers labor costs, filter material costs, and fan energy costs for the cost calculations conducted. Figure B.1 shows these costs per filter.
In order to get from this information to actual operating costs of filter installations in a building the quantity of required filters needs to be determined. enVerid calculated this filter quantity as follows:
With this information in hand, operational expenditure due to filters can be determined using the equation in Figure 8.
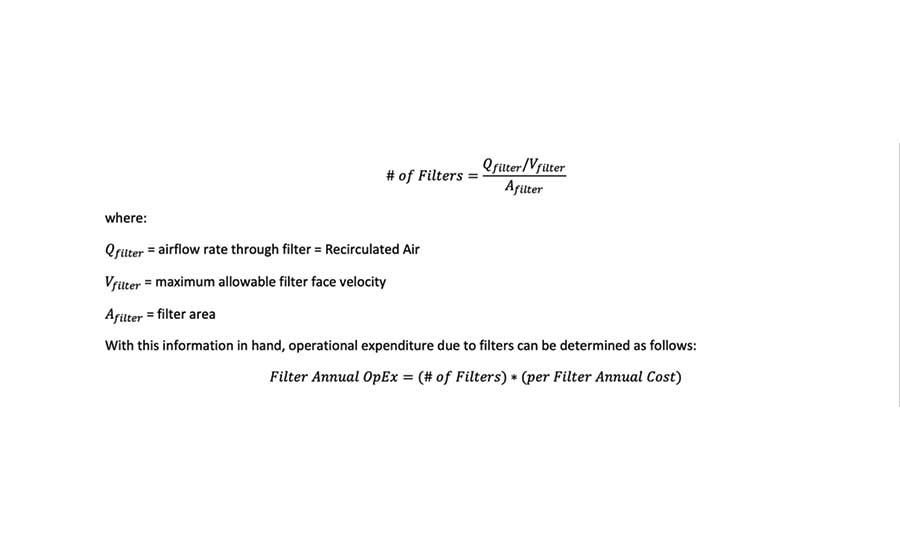
Figure 8. An equation that delivers the actual operating costs of filter installations
B1.2 HLR cooling energy savings Sensible and latent cooling energy savings from load reduction is based on decreasing outside airflow requirements after applying IAQP and air cleaning. Outside air reduction is offset by increased return air to maintain constant primary airflow. For each occupied hour, the enthalpy of outside air is calculated using five-year (2009 to 2014) historical weather data and return air enthalpy using assumed indoor conditions.
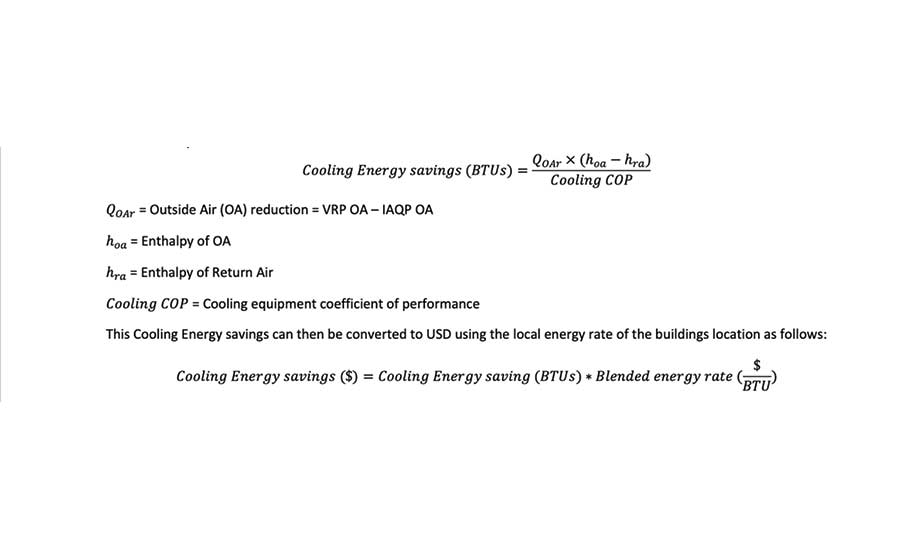
Figure 9. For each occupied hour, the enthalpy of outside air is calculated using five-year
B1.3 HLR heating energy savings Sensible and latent heating energy savings from load reduction is based on decreasing outside airflow requirements after applying IAQP and air cleaning. Outside air reduction is offset by increased return air to maintain constant primary airflow.
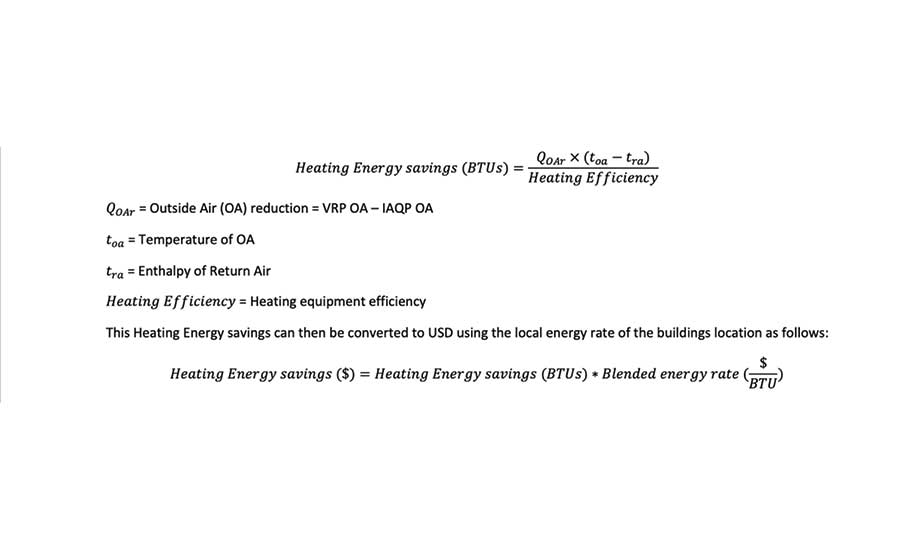
Figure 10. For each occupied hour, the temperature of outside air is determined using 5-year
B1.4 HLR Parasitic Load HLR module parasitic load is calculated based upon estimated runtime hours. The yearly adsorption and regeneration hours depend on the climate zone the unit is installed in and whether economization is utilized. For purposes of this paper, adsorption runtime hours were estimated to be 2,500, and regeneration runtime hours were estimated to be 417.
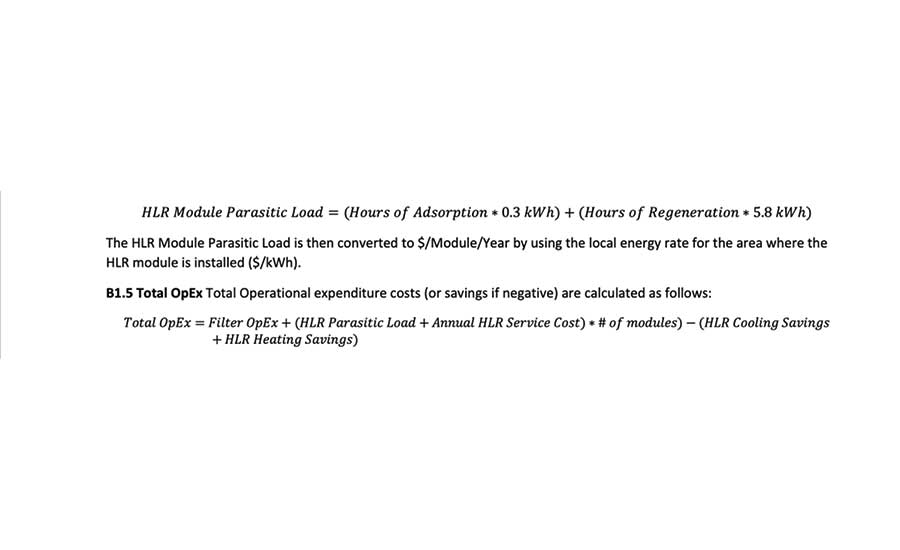
Figure 11. For each HLR module one year of parasitic load can be calculated as follows.
B.2 Capital Expenditure Calculation Methodology Capital expenditure was computed for these calculations relative to VRP with no filtration. For all cases, a capital expenditure was calculated for installing filters in a system. For IAQP cases, heating and cooling savings were realized due to outside air reduction.
B2.1 Filters To estimate filter capital expenditure, enVerid assumed Initial Filter installation cost was equivalent to ¼ of yearly filter operational costs. Methodology is outlined in B1.1
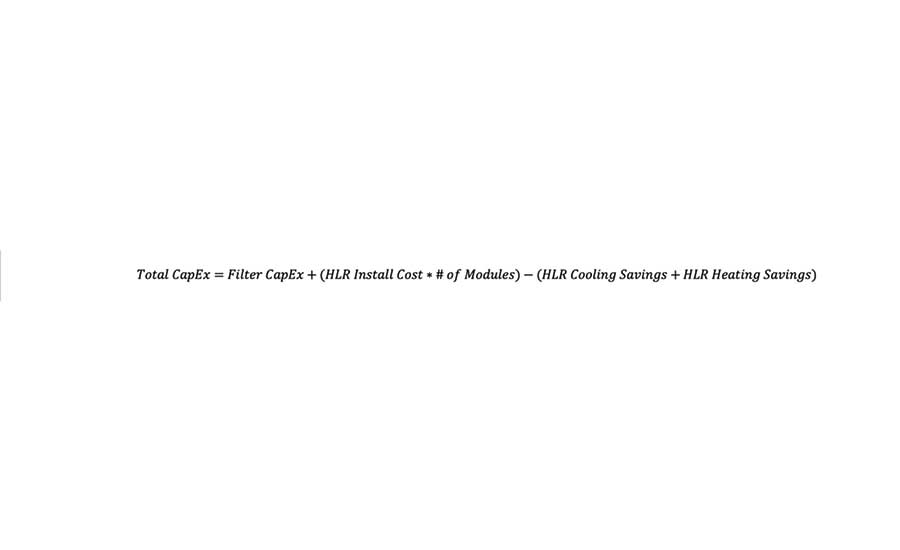
Figure 12. Total Capital expenditure costs (or savings if negative) are calculated as follows.
B2.2 Cooling load reduction is calculated in a similar methodology to energy savings but only for the hottest hour of the year. Summer design day OA enthalpies were determined using the 0.4% dry bulb temperatures and 0.4% mean coincident wet bulb temperature (MCWB). enVerid used a COP of 3.0 and estimated $2,000 saved per cooling ton reduced for the purposes of this calculation. In practice, these rates will change as a function of equipment cost and cooling COP.
B2.3 Heating load reduction is calculated in a similar methodology to energy savings but only for the coldest hour of the year. Winter design day temperatures were determined using the 99.6% dry bulb temperature. enVerid used a heating efficiency of 100% and estimated $20 saved per MBH reduced for the purposes of these calculations. In practice, these rates will change as a function of equipment cost and Heating Efficiency.
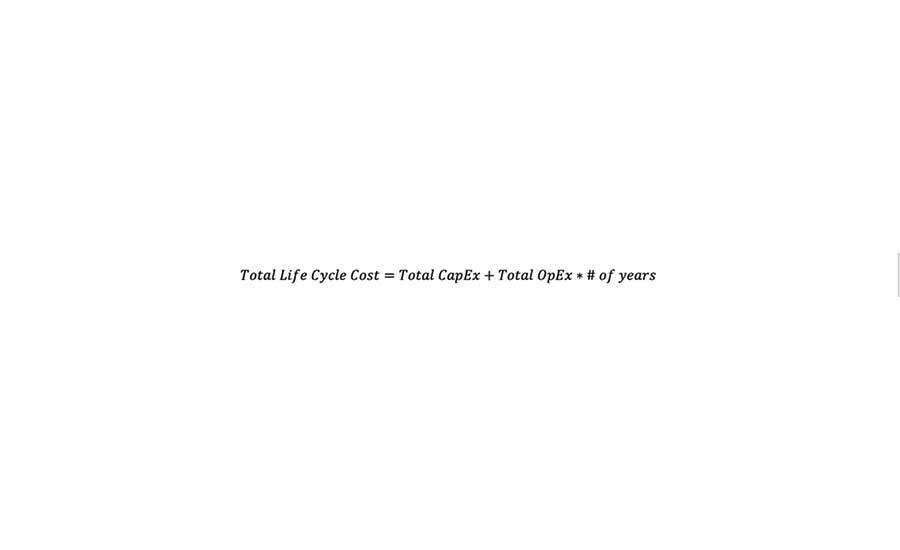
Figure 13. Total life cycle cost (or savings if negative) was calculated as follows.
B2.4 Total CapEx Total Capital expenditure costs (or savings if negative) are calculated in Figure 12.
B.3 Life Cycle Cost Calculation Methodology + Assumptions Total Life Cycle cost (or savings if negative) are calculated in Figure 13. To calculate life cycle costs, the inputs from Table 3 were used.
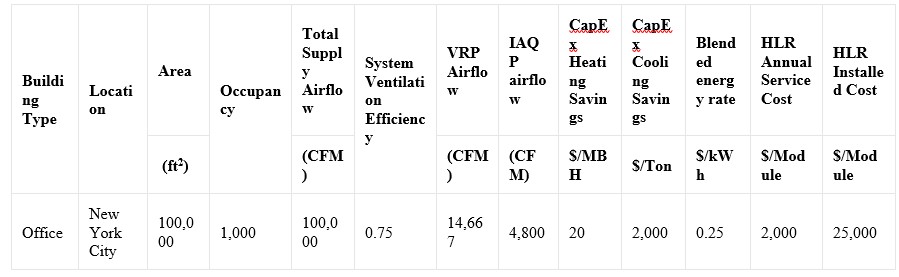
Table 3. Assumptions and theoretical building parameters.


