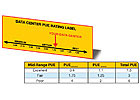
Figure 1. Possible PUE label and rating guide.
Just what you need: another acronym. But the PUE can be a valuable tool for evaluating parts of a data center and, more importantly, for developing a cohesive HVAC plan for a facility based on its location and design as well as its individual equipment. See how the PUE ties into the EPA’s latest data center report, and get familiar with the metric that could abbreviate your energy expenses.
The use of the power usage effectiveness (PUE) metric to determine the efficiency of data centers has been gaining momentum in the technology industry. While definition of PUE is generally understood, there is still little information on actual benchmarking and more importantly, on what is considered as an acceptable minimum PUE. Also, understanding the components that make up the PUE will enable a robust analysis of how to maximize (or optimize if other factors such as first cost, reliability, and environmental impacts need to be considered) the efficiency.
PUE Basics
UE takes into account how power is used for all systems within the data center: cooling, power distribution, and other ancillary systems. The focus of this article will be on specific strategies to improve the PUE of the cooling systems for a data center. These strategies will consider cooling system type, impacts of reliability, geographic/climate impacts, and design strategies.You can develop a PUE for the power and cooling systems individually, but calculating a comprehensive PUE representing the entire facility can be more helpful. The PUE is a measure of power efficiency and is represented by the equations:
PUE = Power delivered to data center = Pmechanical + Pelectrical + Pother
IT equipment power use = PIT
PUEmechanical = Pmechanical
PIT
PUEelectrical = Pelectrical
PIT
PUEother = Pother
PIT
Graphically represented, power is measured at the main utility transformer, mechanical switchgear, UPS, and miscellaneous load panels. Measuring the input and output power will also indicate efficiency of different electrical components, which becomes one more component in the overall determination of power efficiency.
Using PUE As An Industry Metric
The passing of public law 109-431 required the EPA to investigate server and data center energy efficiency. The report, which was released for public review in April 2007 and in its current, final form in August 2007, details information on the amount of electrical power consumed from data centers as well as potential solutions to reduce the long term impacts of the power required to drive technology. While it is not yet known if this study will create compulsory reductions in energy use, one of the common themes discussed in the report was defining an industry-accepted efficiency metric that is meaningful for data center facilities.As an example of this, the final report, EPA Report to Congress on Server and Data Center Energy Efficiency, states: “The federal government and industry should work together to develop an objective, credible energy performance rating system for data centers, initially addressing the infrastructure portion but extending, when possible, to include a companion metric for the productivity and work output of IT equipment.”
- The PUE metric would satisfy the infrastructure portion, while a yet undefined metric, such as flops/Watt or Watt/core, would be developed at a future date. Envisioning when the PUE could become an industry-accepted metric (Figure 1), it would enable programs and processes such as:
- Comparison of a proposed data center design against a reference design (similar to the process used in the ASHRAE 90.1 Energy Standard)
- Identification of sources of inefficiency in the mechanical and electrical systems
- Development of best practice design approaches that lower cost and increase efficiency
- Assessment of existing data centers against industry benchmarks
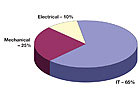
FIGURE 2. Breakdown of overall power use in data centers.
Using PUE To Define And Differentiate
So how can the PUE be used to analyze alternative system types in order to arrive at a decision? This is another area where the interdependencies are vital to identify. Climate, cooling system type, power distribution topology, and redundancy level (reliability, availability) will drive the power efficiency of these systems. When an analysis is performed to determine peak and annual energy use of the facility, these interactions will become obvious.Of the total energy use of the facility, the mechanical system can consume approximately 25% to 50% of the total, and of that, the power required for cooling will typically be close to 50% (Figure 2). The design, control, and operation of the mechanical system will have a significant influence on the annual energy use of the facility and obviously presents an opportunity to reduce energy consumption.
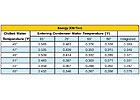
TABLE 1. Example of a 1,000-ton centrifugal chiller power consumption per ton of
cooling at varying chilled water and condenser water temperatures.
cooling at varying chilled water and condenser water temperatures.
Efficiency Of Power Distribution Components For Mechanical Systems
Mechanical system efficiency is affected by the elements contained within the mechanical system map. These elements include the transformation from medium voltage to low voltage in support of the mechanical systems, conversion to mechanical UPS losses for those electrical backed up by UPS power (e.g., CRAC fans or chilled water pumps), mechanical cable distribution losses, and the entire dedicated mechanical plant.Electrical System Efficiency
The electrical power consumption includes all the power losses starting from the utility main transformer through the UPS (typical efficiency 0.85 to 0.96), STSs, power distribution units (PDU) (typical losses 1% to 2%) and remote power panels (RPPs) to the IT equipment and cable distribution losses (typical losses 0.5% to 1%). These various power distribution systems result in a typical electric PUEelectrical range from 1.1 to more than 1.4Mechanical System Efficiency
Since the largest power consumer in the mechanical system is the chiller (or other type of heat rejection equipment), one primary strategy to decrease overall energy consumption is to elevate the supply air temperature by increasing the chilled water supply temperature and/or reducing the temperature of the air moving across the condensing coil.However, the ability to incorporate this strategy will completely depend on the type of mechanical system, the climate, and the allowable supply air temperature for the IT equipment. Consider that for fixed speed chillers, every 2°F increase in chilled water temperature can increase chiller energy efficiency 1% to 2%. For VSD chillers, every 1° increase in chilled water temperature can result in a 2% to 4% efficiency increase. Therefore, increasing the supply air temperature from 60° to 75° will result in an average efficiency increase of the chiller of nearly 30% (Table 1).
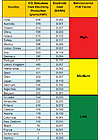
TABLE 2. International CO2 emissions and electricity costs with the PUE multiplier
concept applied.
concept applied.
Effects Of Climate
As if this problem weren’t difficult enough to solve, layering in local climate conditions and utility rate structures will make the equation even more complex. As owners evaluate potential locations for new facilities, they must consider a wide range of issues from climate to energy costs to power availability. Therefore, it is essential to look at the whole picture, not just geographic location. Climate is a major driver of system efficiency. The DOE defines climate zones by both drybulb temperature and humidity levels (Figure 4). Identical mechanical systems will have a different PUE depending on the climate.So depending on the mechanical system type and the climate, the cooling system PUE will range from approximately 0.42 for a chilled water system with cooling towers located in a temperate climate (climate zone 6B) to 1.2 for water cooled, direct expansion A/C units in a hot, humid climate (climate zone 1B). This represents more than a 185% increase in power for cooling systems solely based on the climate and mechanical system type (Figure 3).

FIGURE 3. DOE climate zones.
PUE And Environmental Concerns
Since the beginning of the decade, there has been an increased awareness on energy use and the associated economic and security impacts of U.S. reliance on non-domestically produced energy sources (i.e., petroleum-based products). Concurrent to this, there continues to be an increasing awareness by the general public about the negative environmental impacts of excessive energy use, whether the consequence is drilling for oil in federally protected wildlife refuges or climate change from CO2 emissions.Even though interest in our environment is not a new topic, it does seem to ebb and flow based on the state of the economy, the U.S. presidential administration, pressure from allied countries, and a wide range of other social, political, and cultural issues that are outside of the scope of what is being presented here.
Based on recent polls, it is clear that the general public continues to rank environmental concerns a top priority amongst other difficult global problems.
Statistics like these illustrate the importance of embracing and promoting ideas that will help reduce the size of the environmental footprint that data centers create. One of the messages presented by the EPA study is that the industry must continue to delve deeper into environmentally responsible planning, design, and operation of data centers and must prepare to embrace yet-untested future innovations.
Also, if PUE becomes a metric to follow, it will be important to look at the CO2 emissions from electricity production in the country where the data center is located as well as other regional environmental concerns on land, water, and material conservation. It might be advisable to adjust the PUE goals based on CO2 emissions if the end goal is to minimize environmental impacts as well as to increase power efficiency.
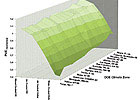
FIGURE 4. PUE of different cooling systems in different climate zones.
Conclusions
Given the increasing electrical power requirements of data centers and the corresponding difficulties in adapting to evolving server technologies, a new opportunity is presenting itself to reduce the overall power consumption of data centers by blending both time-tested strategies and emerging technology into a comprehensive power optimization plan.The adoption of PUE as a metric is one means of achieving this. It is not only important to look at the multiple aspects of data center performance itself, but also the greater positive impact on the environment that these strategies could elicit.
Understanding and analyzing all of the interdependencies that exist between the computer equipment, the cooling systems, the building envelope, and the utility grid, will yield a much more holistic approach and will allow for prioritization of the different elements and customization of each individual situation.
Finally, remember that as technology continues to assume greater importance in people’s daily lives, the need for computing and storage servers and other types of computer equipment (often residing in large, centralized data centers) will also continue to increase. This will certainly drive future requirements to reduce overall power consumption, either as an operational expense reduction, as environmental initiative, or both.ES
