- Airstream characteristics;
- Capacity;
- Pressure;
- Power;
- Efficiency; and
- Fan system curves.
In the first article of the series we discussed the airstream characteristics, capacity, and pressure. In this article, we will discuss fan power, fan efficiency, and fan system curves.
Fan Power
Fan horsepower is normally referred to as brake horsepower, or BHP. However, we can gain a clearer understanding of fan horsepower if we look at power in the following categories:
- Chart horsepower (CHP);
- Operating horsepower (OHP); and
- Air horsepower (AHP).
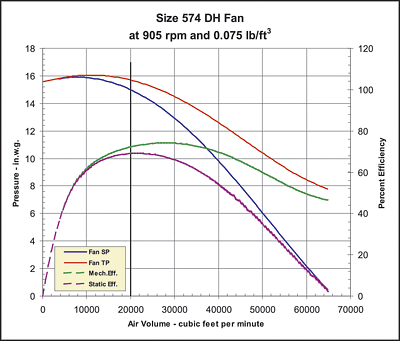
Chart Horsepower
CHP is the power required at the fan shaft to drive the fan. It normally includes bearing drag loss, but does not include any other losses, such as belt drive loss.CHP is always stated at standard inlet density conditions (0.075 lbm/cu ft), and should be corrected for non-standard inlet airstream density. Refer to Part I of this series, which describes standard inlet airstream conditions. Corrections for inlet airstream density are calculated by multiplying the standard density, airflow, pressure, and power by the density factor. The density factor (Df) is calculated as following:
- Temperature, °F: Dft = (530) Π (460 + inlet temperature, F);
- Pressure, in. w.g.: Dfp = (407 + inlet pressure) Π 407;
- Moisture, lbm water/lbm dry air: Dfm = (1 + v) Π (1 + 1.607v), where v = lbm water/lbm dry air; and
- Elevation, ft above sea level (asl): Dfe = [1 - (6.73 x 10 -6)(z)] 5.258, where Z = elevation in ft.
Example 1:
- Inlet temperature, 180°F Dft = (530) Π (460 + 180) = 0.828;
- Inlet static pressure (sp), (-)12 in. w.g. Dfp = [407 + (-12)] Π 407 = 0.971;
- Inlet moisture, 0.025 lbm/lb dry air Dfm = (1 + 0.025) Π [1 + (1.607)(0.025)] = 0.985; and
- Elevation, 3,000 ft asl Dfe = [1 - (6.73 x 10 -6) (3000)] 5.258 = 0.898.
Density factor is calculated as following:
- Density factor Df = (0.828)(0.971)(0.985)(0.898) = 0.711
The actual airstream density at the fan inlet, Da is the product of the density factor, Df and the standard air density (0.075 lbm/cu ft).
- Actual density Da = (0.711) (0.075 lbm/cu ft) = 0.0533 lbm / cu ft.
CHP is the horsepower stated by the fan manufacturers in published literature and selection programs and is often referred to as BHP. The term CHP is sometimes easier to understand, since this horsepower originates from the fan manufacturers' fan ratings charts.
As such, the fan horsepower stated by the fan manufacturer from its published charts or selection programs represents only the power required to drive the fan shaft - and only at standard airstream density conditions of 0.075 lbm/cu ft.
This means that in most cases the fan CHP rating will either understate or overstate the actual operating horsepower, according to the effects of the drive system losses and any change in inlet airstream density.

Operating Horsepower
OHP is the horsepower consumed by the fan and its driver during operation. It includes the energy required by the fan shaft (CHP or BHP), the energy required by the driver, and the effects of any changes in inlet airstream density from standard conditions.- OHP = (CHP x density factor) + (drive loss).
Example 2: If a fan is selected for 30,000 cfm, 15 in. sp, 1,900 rpm, and 95 hp based on the manufacturers' catalog ratings but installed at the above nonstandard conditions (Example 1), then the fan operating performance would be:
- The volumetric capacity would be 30,000 cfm;
- The actual static pressure delivery would be 12 in. w.g. x 0.711 = 8.53 in. w.g.;
- Calculated airstream density = 0.0533 lbm/cu ft (Example 1);
- Density factor = (0.0533 lbm/cu ft) Π (0.075 lbm/cu ft) = 0.711;
- V-belt drive loss from AMCA = 4% of actual chart/brake horsepower;
- OHP = (BHP x density factor) + (drive loss): = (95 x 0.711) + (4% of 95 hp x 0.711); = (67.5 hp) + (2.7 hp); and = 70.2 OHP.
One might decide to select a 75-hp motor for this particular fan application. But note that with a drive loss of 4%, the primary difference between the chart horsepower and the operating horsepower is due to the change in airstream density.
Further, note that within the airstream density factor calculation the temperature, pressure, and moisture components are variable, while the elevation component is fixed.
This means that:
- The lower OHP (70.25) is only realized when the airstream density factor is 0.711;
- The drive loss effect (4%) and the elevation factor (0.898) represent a cumulative fixed factor of 0.934; and
- Applying the fixed factor of 0.934 to the CHP, the operating horsepower is 88.7, which means that a 100-hp motor should be selected in lieu of a 75-hp motor - unless either a volume control damper or variable-frequency controller is used to keep the operating horsepower under 75 hp until the airstream density reaches its design condition of 0.0533 lbm/cu ft.
In summary, operating horsepower allows for changes in airstream composition and the energy losses required to drive the fan, and both the OHP and CHP should be considered in motor selection.
And, in some cases the final motor selection will be based not on the above criteria, but on the minimum motor horsepower required to start the fan and bring it up to full speed. This is the effect of the combined wheel, shaft, and driver inertia (wk2) required to put the fan in rotation from a resting position.
Air Horsepower
AHP is the energy added to the airstream per unit of time and is considered to be the horsepower output of the fan.- AHP = (cfm x total pressure) Π 6,356;
- Using 30,000 cfm and 13 in. w.g. total pressure; and
- AHP = (30,000 x 13) Π 6,356 = 61.4 hp added to the airstream.
It is often helpful to calculate the AHP output of the fan in order to better understand the construction requirements of the fan system and the energy available within the system.
Key point: CHP is:
- The energy required to drive the fan shaft as stated in the fan manufacturers' published charts and data;
- Is based on standard airstream density (0.075 lbm/cu ft); and
- Does not include the energy consumed by the fan driver.
OHP is:
- The actual horsepower consumed in operation and includes both the energy consumed by the fan driver and the effects of changes in airstream density.
AHP is:
- The useful energy added to the airstream by the fan.
A proper understanding and calculation of chart, operating, and AHP values is necessary to fully understand the energy requirements, consumption, and delivery of a fan system.
Fan Efficiency
Fan efficiency is the ratio of the horsepower output of the fan to the horsepower input to the fan. From the preceding section on fan power, the horsepower output is defined as the AHP, and the horsepower input is defined as the CHP.- Fan efficiency = horsepower output ÷ horsepower input; and
- Fan efficiency = AHP ÷ CHP.
Fan efficiency can be evaluated either on the basis of total pressure or static pressure. As discussed in Part I of the series on fan pressures, total pressure, and static pressure are summarized as follows:
Total pressure is the algebraic sum of the velocity pressure and the static pressure at any point in a system and represents the total energy at the point of measurement.
- Total pressure = velocity pressure + static pressure.
Static pressure is the potential energy exerted in all directions by the fluid.
- Static pressure = total pressure - velocity pressure.
When the total pressure basis is used, the fan efficiency is defined as mechanical efficiency, and both the static and velocity pressure components are considered.
When the static pressure basis is used, the fan efficiency is defined as static efficiency, and only the static pressure component is considered. Mechanical and static efficiency are calculated as follows:
- Mechanical efficiency = (total pressure x cfm) ÷ (6,356 x CHP) x 100%; and
- Static efficiency = (static pressure x cfm) ÷ (6,356 x CHP) x 100%.
Since mechanical efficiency is based on the fluid in motion while static efficiency is based on the fluid at rest, fan evaluation and selection based on mechanical efficiency normally represents the truest performance measure of the fan's capability.
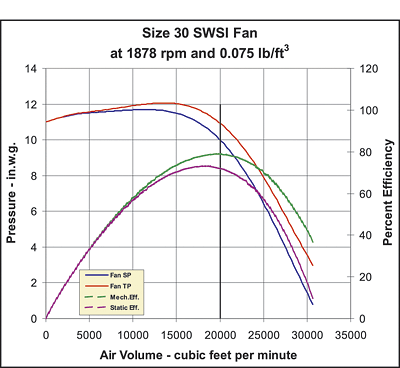
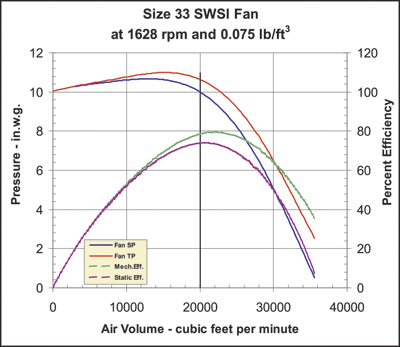
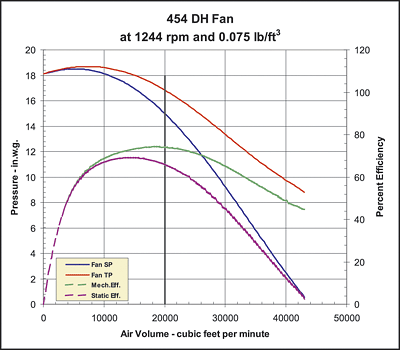
And, as shown on Figures 1 and 2 and again on Figures 3 and 4, where 1 and 2 represent a typical selection for a backward inclined wheel at 20,000 cfm and 10 in. w.g. sp, and where 3 and 4 represent a typical selection for a radial wheel at 20,000 cfm and 15 in. w.g. sp:
- Fan selection based on mechanical efficiency normally results in a point of operation further to the right of the peak of the fan curve than a selection based on static efficiency; and
- Fan selection based on mechanical efficiency normally results in the selection of a smaller size fan, saving both capital cost and plant space.
Fan and System Curves
Fan performance can be predicted by using what is commonly referred to as the fan laws. The fan laws state that:- Fan capacity varies directly with fan speed;
- Fan pressure varies with the square of the change in fan speed; and
- Fan power varies with the cube of the change in fan speed.
It should be noted that the fan laws are applicable to fans on the basis that airflow through the fan is in turbulent flow. And, while it is not uncommon to apply the fan laws to fan systems in order to predict system performance, one must be careful to ensure that the fan system - in its entirety - is also in turbulent flow.
However, it is not uncommon for a fan system to have at least one or more component section or sections through which the airflow has transitioned into laminar flow (generally, velocities of 500 fpm and less are considered to be in laminar flow).
In these cases, the fan laws cannot be directly applied to the system component(s), which are operating in laminar flow, and other means must be taken to accurately predict system performance. For these cases, the system is separated into turbulent and laminar flow components for separate calculations, which are later joined back together for a predictable system performance curve.
System curve C (Figure 5) represents turbulent flow conditions in which the system pressure varies with the square of the system flow.
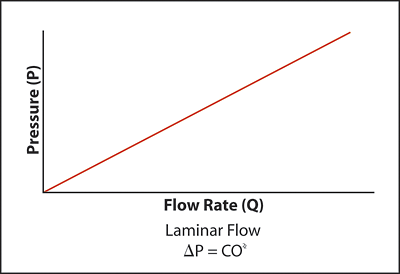
System curve D (Figure 6) represents laminar flow in which the pressure component varies directly with the capacity. In this case, the fan laws cannot be applied to this component of the system curve, and it must be calculated separately.
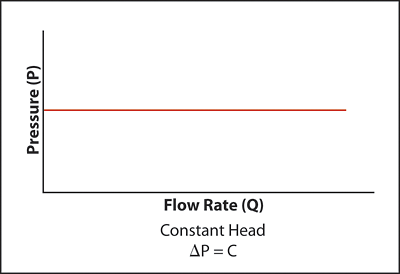
System curve E (Figure 7) also represents laminar flow in which the pressure component is constant with the change in capacity. In this case, the fan laws cannot be applied to this component of the system curve, and it must be calculated separately.
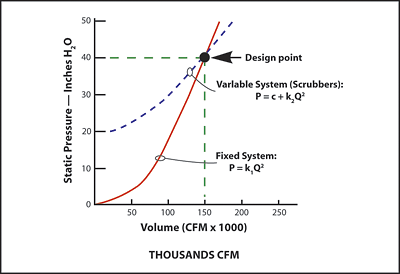
An example of how these calculations are carried out is shown in fan system curve F (Figure 8), in which:
- A typical system curve based on turbulent flow is shown in bold as "fixed system," with the change in pressure corresponding to the square of the change in flow;
- In the "variable system" shown in a dash lined curve, there is a laminar flow scrubber in the system which represents a constant pressure of 20 in. w.g.; and
- The resulting system curve for the variable system is calculated based on the 20 in. w.g. pressure occurring during laminar flow plus the pressure in the turbulent flow section varying with the square of the change in flow.
- At 150,000 cfm, based on the scrubber manufacturer's data, the laminar flow scrubber section represents 20 in. w.g. sp;
- At 150,000 cfm, calculations for the turbulent flow section of the system also represent 20 in. w.g. sp;
- The system design point is then 150,000 cfm at 40 in. w.g. sp; and
- The system curve for the variable system can be calculated using 20 in. w.g. as the "0" reference for the x-y axis and then calculating the turbulent flow section component using the fan laws:
- (100,000 cfm ÷ 150,000 cfm)2 = Static pressure new ÷ Static pressure design;
(0.44) (20) = Static pressure new; and
8.89 in. w.g. = Static pressure new.
- Since the laminar flow scrubber represents 20 in. w.g. at 100,000 cfm; and the turbulent flow section represents 8.89 in. w.g. at 100,000 cfm; then
- The static pressure at 100,000 cfm for the variable system is 28.89 in. w.g.
- 100,000 cfm at 28.89 in. sp becomes the second plot point for the variable-system curve. All other plot points can be generated in the same manner for an accurate variable-system curve.
ES
EDITOR'S NOTE: Some of the equations and symbols associated with this article do not translate to the Internet. To view these items, please refer to the print version of this issue of ES.
