
TABLE 1. Aggregate data. Source: Industrial Motor System Optimization Projects in the U.S.: An Impact Study.

TABLE 2. Fan system efficiency.
Footnotes:
1) Source: AMAC, 100% for direct drive, 94% for adjustable speed drive (ASD), and 94% to 97% for belt drive.
2) Source: AMAC, excessive losses at the inlet and outlet to the fans.
3) Source: EDR, excessive losses in air distribution system.
Footnotes:
1) Source: AMAC, 100% for direct drive, 94% for adjustable speed drive (ASD), and 94% to 97% for belt drive.
2) Source: AMAC, excessive losses at the inlet and outlet to the fans.
3) Source: EDR, excessive losses in air distribution system.
Today's energy-conscious engineers and facility managers evaluate the entire system to achieve the ultimate efficiency. An ideally designed and operated fan system has to include proper application of electrical motors, drives, use of optimal electric power quality, proper maintenance, and, of course, efficient air distribution design. Significant progress has been made in retrofitting the existing fan systems to upgrade system energy efficiency.
Of course, the major difference between new and retrofit projects is the economic feasibility of the efficiency upgrades that hinder some of the retrofit projects. The implementation of energy-efficiency retrofit projects depends on an organization's expected payback and internal rate of return (IRR). However, new projects have much easier economical criteria by which to implement energy saving measures.
According to the DOE, nearly 70% of all electricity consumption by U.S. industries - 553 billion kWh/yr - is used by motor-driven equipment, which equates to $30 billion annually. Of this amount, 14% or 77 billion kWh/yr is used by fan systems. The potential energy savings just in optimizing motor systems has proven to be significant, according to a study published by the DOE.
Through its "Best Practices" programs, DOE studied industrial motor energy savings projects. These programs are intended to raise energy savings awareness and demonstrate the economic feasibility of the implementations. A DOE impact case study between 1995 and 2001 of 41 industrial motor system optimization projects indicated substantial amounts of energy savings as displayed in Table 1.
The study calculated the effect of energy savings, the net present value (NPV) of project savings, and the IRR. Since this study analyzed the aggregate rate of return, the IRR is labeled as collective rate of return (CRR). From the 41 projects in the study, 35 were recognized as capital spending projects that required new equipment, such as motors or ASDs. The six other projects required reconfiguration or adjustment to the existing motor and the controls, and were referred to as re-engineered projects. From the 41 accumulated results in the study, two were skewed due to their implementation being intended for improving reliability rather than energy savings, which resulted in higher NPV and CCR. The capital spending projects met their 10-year NPV and the re-engineered projects met the five-year NPV. The payback analysis was a complementary measure of the study.
SYSTEM EFFICIENCY
To evaluate fan system efficiency, all components must be considered to calculate the overall system efficiency. Table 2 demonstrates the significance of considering all system components to calculate the operating system efficiency. The component's relationship is as follows:h system = h distribution x h installation x h motor x h drive x h fan
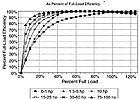
FIGURE 1. Motor part-load efficiency. Source: Motor Challenge-DOE.
DETERMINING MOTOR EFFICIENCY
Replacing a motor with a high-efficiency model has the most benefit if it is performed in combination with a motor load evaluation. It is a customary practice that a burned out motor be replaced with exactly the same size albeit more efficient motor. In some other cases, since the plant inventory is limited and only a number of sizes are kept on the site, the next available motor size is often installed. In addition, during the design process, many factors, such as future anticipated system expansion, force the engineer to oversize the motors beyond the peak efficiency range. All these factors could result in undersized or oversized motors, which both contribute to motor inefficiency.As described by the National Electrical Manufacturers Association (NEMA), motor efficiency at a given horsepower is the expected delivery of mechanical work at the motor shaft presented by the following equation:
h efficiency in % = (0.746 x hp rated horsepower x Load output power as a % of rated power) / P power in kW
Rearranging the above equation results in a relationship that is frequently used to calculate the annual energy savings based on high efficiency motor replacement as in the following:
Savings = 0.746 x hp x hr x Load x C x [100/ Estd - 100/Eee]
Where:
hp = Motor-rated horsepower
Load = Motor load factor (percentage of full-load/100)
C = Average energy costs ($/kWh)
Estd = Standard motor efficiency rating, %
Eee = Energy efficient motor efficiency rating, %
P = Power in kW
h = Efficiency, %
NEMA publishes full and part-load efficiencies of NEMA design A, B, and C for motors up to 500 hp. By knowing the efficiency of a motor at full load and the rated horsepower, the output power can be calculated. However, the key factor in this calculation is determining the load factor. The power input (P) is the value used to determine the power consumption, subsequently, the energy savings when a premium efficiency motor is considered in lieu of a standard efficient motor. Motor replacement retrofit projects require detailed investigation in establishing the actual load on the motor.
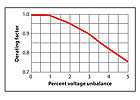
FIGURE 2. Source: NEMA.
MOTOR PART-LOAD EFFICIENCY
Motor performance, among other factors, is dependent on the loads conducted by the motor. As shown in Figure 1, motors have an optimum part load performance range in which they operate more efficiently. For example, a 30-hp motor has an optimum performance range between 60% and 80% of its full load. Beyond this range a motor, although it will operate, will perform inefficiently. Therefore, matching the motors to their loads is a significant energy savings component in the fan selection. Predominately, three methods are used to establish the motor loads: input power measurement, slip measurement method, and computerized load and efficiency estimation techniques.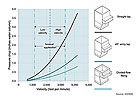
FIGURE 3. Efficiency impact of duct fittings. Source: ASHRAE, PECI.
INPUT POWER MEASUREMENT METHOD
Once the measured voltages and currents are determined, use the following equation to calculate the power Pi from the following:Pi = (V x I x PF x √3) ÷1,000
Where
Pi = Calculated three-phase power in kW
V = RMS voltage, mean line-to-line of three-phase power
I = RMS current, mean of three-phase
PF = Power factor as a decimal
Then calculate Pir as following:
Pir = hp x 0.7457 ÷ h
Where:
Pir = Input power at full-load
hp = Nameplate-rated hp
h = Efficiency at full-load
The last step is to calculate the load as a percentage:
Load = (Pi ÷ Pri) x 100
Where:
Load = Output power as a % of rated power
Pi = Measured three-phase power in kW
Pir = Input power at full-load in kW

FIGURE 4. Screen shot of the MotorMaster+ database.
SLIP MEASUREMENT METHOD
The slip measurement method is recommended only when operational speed is available. The synchronous speed of a motor is a function of power frequency and the number of poles on the motor for which the motor is constructed. The difference between the actual speed and the synchronous speed is referred to as slip. The percentage of slip and load are directly proportional.The percentage of the load is calculated as following:
Load = Slip ÷ (Ss- Sr) x 100%
Where:
Load = Output power as a % of rated power
Slip = Synchronous speed - measured speed in RMS
Ss = Synchronous speed in rpm
Sr = Nameplate full load speed
For instance, a 60-hp motor with a four-pole construction has 1,800 rpm synchronous speed, and has 1,750 rpm full-load nameplate speed. If the measured rpm speed is 1,780, the actual motor output hp is:
Load = (1,800-1,780) / (1,800-1,750) x 100% = 40%
The actual output horsepower is: 40% x 60 = 24 hp
In this example, the motor operates at only 40% of its rated capacity, so the motor efficiency is de-rated. This calculation makes the motor replacement economic analysis the next step in improving the fan system efficiency.
The synchronous method for measuring motor load is convenient but is inaccurate for several reasons, which are beyond the focus of this article.
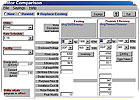
FIGURE 5. Screen shot of the MotorMaster+ motor replacement calculation.
COMPUTERIZED LOAD AND EFFICIENCY ESTIMATION METHOD
The Oak Ridge National Laboratory has developed OMEL 96 (Oak Ridge Motor Efficiency and Load, 1996), a computer program to calculate the load by using an equivalent circuit method. Only nameplate data and a measurement of rotor speed are required to compute the load factor and motor efficiency. Dynamometer tests have shown that this method effectively produces accuracy within ±3 percentage points of actual values, which is valid for motors loaded from 25% to 100% of their rated capacity.
TABLE 3. Energy cost analysis.
HOW POWER QUALITY AFFECTS MOTOR EFFICIENCY
Voltage unbalance has adverse effect on motor efficiencies although motors are constructed to work within a specific range of the nominal voltage. Motors built for a 480V system are rated at 95.8%. For example, motors that are constructed for 480V systems are rated for 460V (480 x 95.8%) and motors for a 240V system are rated for 230V (240 x 95.8%), and so on.On the other hand, motors are de-rated if the rated voltage falls below 95.6%. For instance, a motor rated at 460V is de-rated if it is connected to an electrical distribution system which is less than 440V (460 x 95.6%). With most motors at about 10% to 15% increase in available voltage, both the power factor and efficiency decreases. Motors operated under voltage, even at 10%, can cause motors to overdraw current to create the torque required, which results in over heating and operation in the service factor area.
Voltage unbalance as defined by NEMA as a percentage of maximum voltage deviation is calculated as following:
Voltage unbalance = 100 x |Vmean - Vmin|/Vmean
For instance, if the measured line-to-line voltages are 466V, 463V, and 452V, the average is 460V. The voltage unbalance is: 100 x (460 - 452)/460 = 1.8 %
Figure 2 expresses the de-rating efficiency effect of voltage unbalance, which becomes more pronounced beyond the 1% voltage unbalanced.

FIGURE 6. Screen shot of the MotorMaster+ life-cycle analysis.
INCREASING EFFICIENCY IN AIR DISTRIBUTION SYSTEMS
Minimizing air friction losses through duct fittings and the adverse effect of poor fan discharge connections are common knowledge to design engineers. These losses contribute to conversion of mechanical energy to noise and vibration. Providing duct connection details on the construction documents can reduce these problems. It is also the responsibility of the installing contractors to ensure the installation corresponds with the engineered system.Lowering losses and improving the process control in the distribution system is highly desirable for system efficiency. These losses occur at the fans, auxiliary devices such as filters or dampers, and duct fittings. Many associations such as ASHRAE and Air Movement and Control Association (AMCA) have developed extensive guidelines for engineers and installers to specify more efficient duct distribution systems. Figure 3 shows a case of pressure drop losses among three different fittings. Table 3 summarizes the cost saving analysis of the three alternative fittings in the above case. Accumulation of these losses in the air distribution system impacts the system efficiency from 5% to 15% in energy cost according to Energy Design Resources (EDR). Ductwork air leakage and insulation are also important factors that could affect the overall system efficiencies.
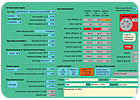
FIGURE 7. Screen shot showing fan optimization results. Source: Fan System Assessment Tool-DOE.
TOOLS
Motor Master+, a computer program, supported and developed by Bonneville Power Administration and the DOE Motor Challenge Program, is an energy-efficient motor selection and motor management tool. The program allows selection of a replacement motor using its internal database of about 27,000 motors from 1 to 2,000 hp (Figure 3). The program has the ability to select the most efficient motor including motor rewind, downsizing, or replacing standard with premium efficiency motors. A typical screen shot of this view is displayed in Figure 4. The analytical features of the program allow for life-cycle analysis based on energy and dollar savings associated with the replacement. Figure 5 represents a typical snapshot of this screen.The Fan System Assessment Tool (FSAT) is another excellent computer program developed by the DOE that can be used to analyze the potential benefits of using a more optimally configured fan system. This program calculates a fan's energy use, determines the efficiency, and quantifies savings for upgrading the system. The program requires extensive and accurate measured field data. Figure 7 is a snapshot of the FSAT main screen.
Energy conservation implementations are inevitable and are a good business strategy. They are supported by utility companies and enforced by local codes and regulations. Achieving the most efficiency is a combined effort among the design engineers, installing contractors, and facility managers to achieve an overview of all components. Accurately filed operating measurements and verification are essential for new design and retrofit projects. Economical justification is the most important factor for retrofit projects in lieu of other operational benefits.
BIBLIOGRAPHY
McCoy, Gilbert A. and John G. Douglass, "Energy Management for Motor Driven Systems," U.S. Department of Energy, Office of Industrial Technologies Energy Efficiency and Renewal Energy."Fact Sheet" U.S. Department of Energy, Motor Challenge Program.
Scheihing, Paul E., U.S. Department of Energy, Industrial Technologies Program, "A National Strategy for Energy Efficient Industrial Motor-Driven Systems," 2005.
Portland Energy Conservation, Inc. (PECI), "Design Briefs: Design Details," (PECI),www.energyresources.com.
Office of Industrial Technology Energy Efficiency and Renewal Energy.
Elliott, R. Neal and Steven Nadel, "Fan and Pump Systems: Markets and Programs," American Council for an Energy-Efficient Economy, April 2002.
