Chances are you already know that the case for doing preventive maintenance (PM) is watertight. Done right, PM will preserve, protect, and extend the life of your equipment. So here’s the question: Why are so many maintenance and reliability professionals unhappy with their PM programs? The two biggest complaints are:
- PM consumes too many resources.
- The results of PM are not what were expected.
After working in maintenance and reliability for over 20 years, I would like to share with you “Five Tips for Optimizing Your PM Program.” These tips are not what I say should be accomplished in order to optimize your PM program, but they are known “best practice.”
PM Tip No. 1: Measure the effectiveness of your PM Program.
“You cannot improve what you cannot measure.”
– W. Edwards Deming
There are a few metrics or measurements one can use to measure the effectiveness of a current PM program.
The simplest measurement one can use to identify if their current PM program is effective or not is “PM labor hours vs emergency /urgent labor hours.” The reason I include urgent labor hours with emergency labor hours is that one should use a known standard definition for a failure. According to the Nowlan and Heap Reliability-Centered Maintenance study:
- Functional Failure is the inability of an item (or the equipment containing it) to meet a specified performance standard.
- Potential Failure is an identifiable physical condition which indicates a functional failure is imminent.
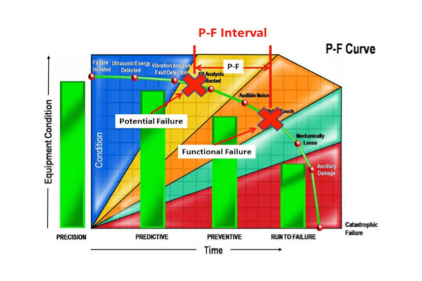
These two failures can be illustrated using the P-F Curve. “P” is the point that evidence from a PdM or PM inspection detects a defect; if the defect is left alone, the potential failure (Point “F” on the P-F Curve) will result in a functional failure.
|
| Figure 1: P-F interval. |
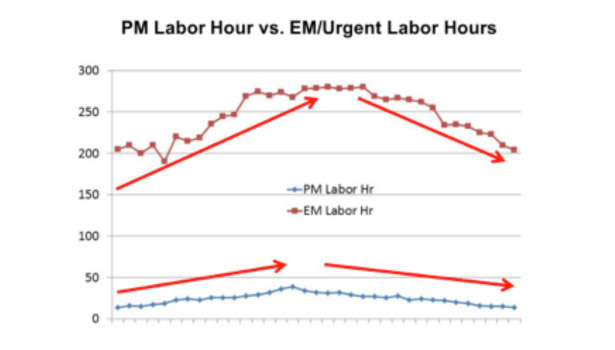
Putting these two measurements together on a line graph provides a facility manager with what I consider to be a clear picture of the effectiveness of the current PM program. Check out the graphs shown in Figures 2 and 3 as examples. These graphs came from different facilities and they tell different stories.
|
| Figure 2: Example no.1 – An ineffective PM program. |
In example no.1, PM labor hours are in red and emergency/urgent labor hours are in blue. What is interesting about this graph is that as PM labor hours increase, so do emergency/urgent labor hours. This is not what one would expect from a PM program that is rock solid. What one would expect from an effective PM program is that as PM labor hours increase, emergency/urgent labor hours would decrease (see Figure 3). As for the facility manager, when he was shown example no.1, he decided to evaluate and optimize his PMs, starting with his most critical PMs, and then continue measuring PM vs emergency/urgent labor hours.
|
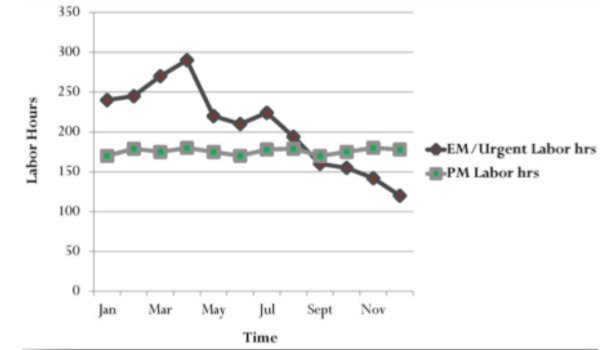
| Figure 3: Example no.2 – An effective PM program. |
In Example no. 2, the emergency/urgent labor hours are decreasing as PM labor hours stay consistent. This graph was assembled after a facility manager reviewed and adjusted his PM program. His PMs became more focused on the elimination or mitigation of specific failure modes (how something fails) after the review and modification of PM procedures.
PM Tip No.2: Preventive maintenance should consume only 15-20% of total maintenance labor hours.
PM in facilities is key to meeting the requirements of the customer (facility owners, users, etc.), thus resources must be used effectively and efficiently. To manage PM effectively and efficiently, as with all proactive maintenance activities, it should be planned and scheduled effectively. Planning for PM activities includes the following items: labor type, estimated labor hours, required material or parts, inspection procedure, specific tools required, etc. Scheduling for PM activities is defined as scheduling all personnel involved in the PM by day/by hour, all PM activities should be scheduled at least a week prior to execution, and operations or facility owners should have agreed to the schedule at least a week prior to execution.
If PM is not planned and scheduled effectively, then maintenance labor, material, and contractor cost are higher (50% to 200%). Maintenance must have a dedicated planner/scheduler for seven to 15 maintenance personnel in order to reduce the excessive waste of money and labor. Typical metrics used in maintenance planning and scheduling are percent of planned work and also schedule compliance by day and by week.
PM Tip No. 3: PM compliance should be measured within 10% of the time frequency.
Measuring PM compliance within 10% of the time frequency is intended to reduce variation in inspection intervals, human performance, and asset reliability. This method is known today as the “10% Rule of Preventive Maintenance,” as shown in Figure 4.
|
| Figure 4: An example of the 10% rule of preventive maintenance. |
Here is how the 10% rule of PM works. The 10% rule of PM states that if a PM is executed within 10% of a time frequency, then it is considered compliant with the standard. An example would be a monthly PM, which must be completed within 1.5 days on each side of the due date in order to be compliant with the 10% rule (I recommend you use 30 days as an average for a monthly PM calculation). The reason for applying this rule is it reduces the variation of PM execution time frequency. In maintenance, we must identify and reduce variation in the maintenance process and this is a great example of where it should be applied.
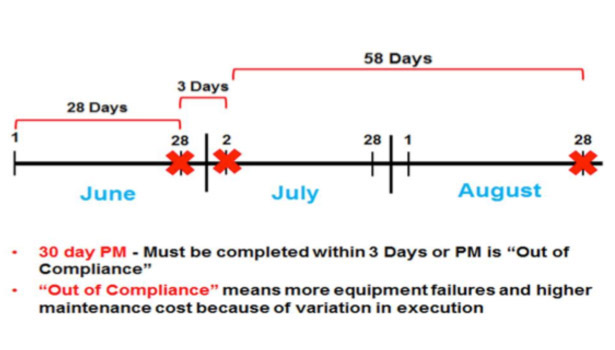
In the following example, you will see the problem with a typical facility PM Program.
A PM from XYZ Facility is a 30-day PM and is executed in June, near the end of the month (there were too many problems at the beginning of the June, so PMs had to be pushed back). At the beginning of July, the same PM is executed (things were going well at the beginning of the month, so PMs were completed because everyone knows bad days are coming). In August, the PM is executed on the 28th of the month because of too many problems at the beginning of the month. After this 90-day period, the 30-day PM is actually a 28-day PM, a 3-day PM, and a 58-day PM. See the problem?
This problem is made worse when an organization uses maintenance software or EAM (Enterprise Asset Management) software that kicks out all PMs for the month on the 1st and you think you have 30 days to complete the PMs. The maintenance crews are told to make sure their PMs are completed within the month so they can meet 100% PM compliance. Can you see the problem now? In many organizations, the focus is on PM compliance rather than stopping failures in their facilities.
Tip No.4: Preventive maintenance should be focused on specific failure modes.
Failure modes are defined as “how something fails.” Let’s use a flat/membrane roof to show an example of what a failure mode is. On a flat/membrane roof, one failure mode may be “penetration of roof membrane,” and the causes of this failure mode could be many. Knowing the failure mode(s) of a specific maintainable item such as a membrane roof and its causes can be key to early detection of roof failure (not meeting the intent of the end user) so the repair can be made before it affects an operation.
The other key item when one has the ability to identify the failure modes and their causes is it allows a maintenance organization to review the causes of a failure mode and possibly put in place a mitigation strategy, such as not allowing unauthorized personnel on a roof. Once an organization knows the specific failure modes and their causes for maintainable items, unexpected events or failures become a rare occasion.
Tip No.5: Predictive maintenance may be the better maintenance strategy.
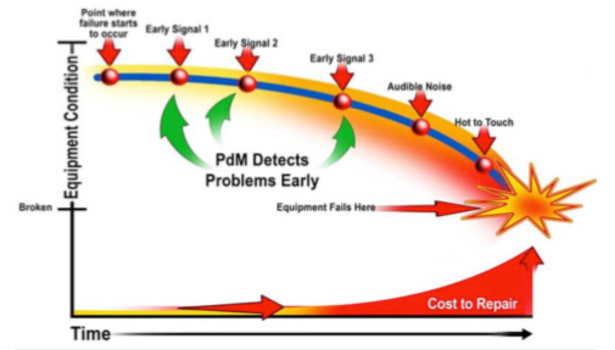
Although the predictive maintenance (PdM) technologies themselves can get quite complicated, the basic concept of PdM is simple enough.
Most maintainable items do not suddenly fail. The truth is that maintainable items wear down gradually over a period of weeks or months. Many times, there are numerous warning signals along the way.
These early warning signs — for instance, slight changes in temperature, vibration, or sound — can be detected by PdM technologies. As a result, PdM gives you time to plan, schedule, and make repairs before the maintainable item fails catastrophically or fails without notice and causes serious problems.
Early detection of a failure is key to optimizing the reliability of any facility. In Figure 5, we have equipment condition on the left side and at the top you will see “Point where failure starts to occur,” which if not corrected, will continue until a total failure occurs. Understanding the P-F Curve methodology is only important when failure is unacceptable.
 |
| Figure 5: The P-F Curve. |
If a failure is unacceptable, then detection of this failure early enough is important so that it can be corrected without disruption to an operation. If this is true for a specific failure mode, then one must use the most effective maintenance strategy for early detection, and this strategy would be PdM (sometimes called condition monitoring), whether using thermography, ultrasound, vibration analysis, motor circuit analysis, etc. If PM is used to detect a failure mode, then it will typically be found too far along on the P-F Curve, and most of the time, failure occurs before action can be taken, causing unexpected problems for an operation.
If you have questions or comments about the information covered in this article, please contact me at rsmith@gpallied.com.