NOVEMBER 2011 TREND LOG ANALYSIS
|
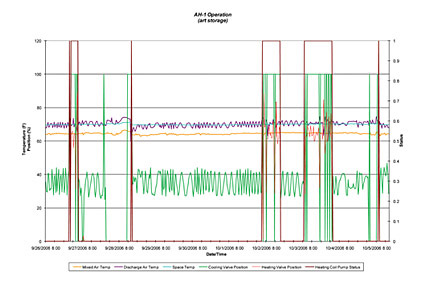
| Figure 1 covers about 10 days in the fall of 2006 |
Last month’s trend graph was for an AHU serving a space with extremely tight temperature and relative humidity requirements. The first thing that was clear from the trend graph was that the space conditions were very steady. The return air temperature appeared to be a constant 71°F with less than a ±1°F variance. Similarly, the return air rh was a steady 50% rh with less than a ±2% rh variance.
The next most noticeable thing about the graph is how solid the colors are, indicating continuous movement of the control devices (chilled water valve, hot water valve, and humidifier). This meant that there was essentially simultaneous cooling/dehumidification, heating, and humidification.
Although we might expect simultaneous cooling/dehumidification and reheating for summertime space humidity control, it was surprising to see the humidifier continuously modulating between 0% to 30% open. There should have been no need to mechanically humidify during the month of August. We believe that the humidification control loop (controlling the humidifier) and the dehumidification control loop (controlling the chilled water valve) were both controlling to a 50% rh setpoint and both loops were not tuned very well. As the return air rh rose slightly above 50%, the humidifier valve closed while the chilled water valve opened nearly fully. This resulted in the return air rh quickly dropping below 50%, causing the chilled water valve to back off and the humidifier to modulate open. This cycle repeated itself multiple times each hour.
The fact that the chilled water valve was swinging back and forth between simple discharge air temperature control (approximately 20% open) and dehumidification control (80% to 100% open), caused the hot water valve to continuously modulate between 20% to 60% open in an attempt to maintain the return air temperature setpoint.
This wild modulation of control devices was not only hard on the physical devices; it used more energy than necessary. Programming a slight deadband between humidification and dehumidification (e.g., control humidification for 49% rh and dehumidification for 51% rh) and fine tuning the control loops could have eliminated the need for any steam in the summertime. It could have also eliminated the overcooling of the supply air and the associated need for more reheat than necessary.
NEW SYSTEM
Figure 1 illustrates an AHU serving a museum’s art storage vault in a northern climate. The vault is located below grade and is typically unoccupied and dark. The environmental control criteria are tight, with art conservators expecting 70° and 40% to 50% rh year round. This is a constant volume, single-zone system with a mixing box, chilled water coil, heating hot water reheat coil, humidifier, and supply fan. There is no airside economizer but only a constant minimum outside air damper to maintain a slightly positive space pressure. This trend analysis was conducted as part of a facility-wide retrocommissioning program, not because there were any known problems with this system.
TRENDS
The BAS was used to trend the following sensor and device data at fifteen-minute intervals:
• Mixed air temperature (yellow)
• Discharge air temperature (purple)
• Space temperature (blue)
• Chilled water valve signal (green)
• Heating hot water valve signal (orange)
• Heating coil pump status (red)


