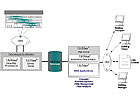
Figure 1. Basic system architecture.
Anyone who has been involved in energy savings performance contracts (ESPC), in the evaluation and validation of energy conservation measures (ECM), or in a LEED® building certification project probably has a good understanding of the M&V process, and most M&V approaches will be consistent with, and adhere to, the definitions and methods outlined in the IPMVP. If the M&V is to be used to verify the actual savings in energy use (cost avoidance) achieved under an ESPC, independent third-party validation should be required. If the M&V is to meet LEED® certification credit requirements, the system must still adhere to the IPMVP.
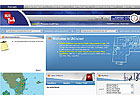
Figure 2. Typical user’s screen views.
Metering and Measuring
Generally, any M&V program will involve some type of metering, either existing or new, and the associated installation (if new), calibration, and maintenance of those meters; a process for collecting and filtering the data; the ability to analyze the measured data; and report generation capability. In all cases, M&V must be accurate, and the accuracy of any analysis will be limited by the accuracy of the meter.Many BAS and integrated equipment control/monitoring/reporting systems have internal functions capable of generating large reports on a regular basis. However, these systems are limited in their ability to plot and trend multiple data points over a user-defined timeline. And if they do have that capability, it is unlikely that they will have the hardware and software capable of collecting and analyzing a large volume of data without degrading the control performance, which is the primary objective of those systems. Since most computer control systems are limited in processing speeds, bandwidth, and storage capacity, attempting to use them to compile large amounts of real-time data, unrelated or unnecessary to the control strategy, can adversely affect critical functionality.
Also, some data points may be important to optimizing energy savings but are completely useless for automatic control (e.g., electric power metering). And, finally, there are no industry standards for the proprietary measurement algorithms that these systems use2. It seems logical, then, to look for alternative metering/monitoring solutions that are not an integral part of the BAS.

Figure 3. Real-time analysis of a chiller.
Building Oversight
One example of such a solution is UtiliVisor3, an online, real-time, building oversight management tool that provides oversight, analysis, and reporting for a building’s mechanical plant (e.g., HVAC) and utility management. It works with existing BAS through non-interfering interfaces that enhance, without disrupting, the operation of the equipment, controls, or BAS. Using these “technology agnostic” interfaces, the system collects and formats data for delivery over the Internet, monitors for operations and equipment error states (alerts or alarms), provides real-time oversight access via the internet, and monitors overall systems performance.Data collection and validation is accomplished on 5-, 10-, or 15-min user-selected intervals across multiple systems with simultaneous error correction for interrupted or lost communications, data points out-of-range, and data anti-aliasing. The system utilizes an industry-standard, SQL-based relational data base (RDB) that reliably maintains 18 months of live data online and the prior 18 months of historic data offline. After that, data can be archived to other media (tape, CD-ROM, etc.). Data post-processing, using such data integrity capabilities such as CAVEE (customer association, validation, editing, and estimation) for sub-metering and directional flow validation for chiller plant analysis, ensures the quality of presented application data. The system’s basic architecture is shown in Figure 1.
The system’s graphical representation and data reporting applications are embedded within the highly secure webpages and presentation server to provide specialized data analysis, reporting, and alarming capabilities. Various levels of entry, from any browser, are provided and data retrieval is “push only” to eliminate internal security concerns in even the most sensitive facility. Figure 2 presents examples of a user’s typical screen views, and Figure 3 illustrates real-time analysis capability.
Since every data point can be plotted with a user-defined timeline and up to 20 points of comparison, cost can be analyzed next to comfort and performance data. This allows implementation of cost reduction measures without sacrificing environmental and equipment considerations. Figure 4 is an example of a custom-generated report.
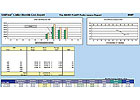
Figure 4. Typical report.
Combining Strategies
Because most building/plant operators are primarily concerned with comfort, it is not unusual to have conditions during which the equipment is over-run, setbacks are manually overridden, or operating schedules are extended. And the results from a number of studies have concluded that energy savings of 5% to 15% can be achieved by implementing a continuous datalogging system4,5,6.These savings result from operational improvements, using the captured data to apply advanced control strategies, to recognize interactive effects to reduce simultaneous heating and cooling, to maximize free cooling, to optimize chiller operation to building load conditions, to adjust condenser and evaporator temperatures, to perform dynamic system flow analysis, and to allow retro- and continuous commissioning.
It seems logical then to combine an advanced monitoring capability with a method for managing the real-time energy costs - while still delivering a healthy, productive, and comfortable environment. This is accomplished by hosting the data in an operations center staffed by experienced engineers, preferably those having one of the following credentials: certified energy engineer (CEE), certified energy manager (CEM), or certified M&V professional (CVMP), and direct plant operating experience with the types of equipment employed.
This operations center should have at least one daily shift of first-level call support and logging capability and 24/7 notice capability; should be capable of providing at least 99.5% uptime and availability; and should be capable of fixing and correcting Level 1 problems and Level 2 and 3 dispatching, recommendations, corrections, and follow-up. The host should also be capable of providing back-up power, on- and off-site storage, and data recovery; Internet security and traffic monitoring with physical access security controls; weather-related failure protection/resolution; and regular updates, error recovery, and e-mail notifications in the event that failures occur.
Building oversight management, then, is that combination of computer technology and fundamental energy engineering that provides M&V … and more.ES
Cited Works
1. Efficiency Value Organization. “Concepts and Options for Determining Energy and Water Savings, Volume 1.” International Performance Measurement and Verification Protocol. April 2007.2. Sparks, R., J. Haberl, S. Bhattacharyya, M. Rayaprolu, J. Wang, and S. Vadlamani. “Testing of Data Acquisition Systems for Use in Monitoring Building Energy Conservation Systems.” Proceedings of the Eighth Symposium on Improving Building Systems in Hot and Humid Climates. Dallas, Texas. May, 1992:197-204.
3. Utility Program & Metering II. “UtiliVisor. ” New York, NY.
4. Claridge, D., J. Haberl, M. Liu, J. Houcek, and A. Aather. “Can You Achieve 150% of Predicted Retrofit Savings? Is it Time for Recommissioning?” Proceedings of the 1994 ACEEE Summer Study. August, 1994:5.73-5.88.
5. Claridge, D., J. Haberl, M. Liu, and A. Athar. “Implementation of Continuous Commissioning in the Texas LoanSTAR Program: Can You Achieve 150% of Estimated Retrofit Savings: Revisited.” Proceedings of the 1996 ACEEE Summer Study, August, 1996.
6. Haberl, J., D. Bronson, and D. O’Neal. “Impact of Using Measured Weather Data vs. TMY Weather Data in a DOE-2 Simulation.” ASHRAE Transactions, V. 105, Pt. 2. June, 1995.
