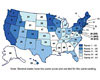
Figure
1. This map shows the overall ranking of each of the
50 states and the District of Columbia in ACEEE’s 2009 State
Efficiency Scorecard. (Source: 2009 State Energy Efficiency Standard,
ACEEE.)
Will 2010 and beyond be even better?
Last year saw remarkable increases in both the breadth and magnitude of incentives designed to help buildings save energy. Energy efficiency budgets of utilities and many other funding sources were up sharply. Several states debuted new incentive programs to help their citizens save energy. The federal government’s “Commercial Building Deduction” was finally getting traction after having been extended for another five years at the end of 2008. And last but certainly not least, the American Recovery and Reinvestment Act began directing massive amounts of taxpayer dollars toward “shovel ready” projects, a significant fraction of which are focused on saving energy in buildings.
So what was driving this dramatic push for efficiency in 2009? Concerns about the potential impact of rising energy costs? The necessity to maintain grid reliability in a cost-effective manner? The need to stimulate the economy by supporting companies and projects that create green jobs? The growing consensus that reducing the unnecessary combustion of fossil fuels was a prudent first step toward addressing climate change? Or perhaps, the realization that energy savings become even more valuable if the economy begins assigning a cost to carbon? No doubt each of these factors played a role. Together, though, they became the proverbial “tipping point” that allowed a wide variety of stakeholders to unite around a common theme of increased energy efficiency in 2009.
An avalanche of new incentives has important implications for managers interested in improving the efficiency of their operations. As the number of potential funding angles continues to increase, keeping abreast of all the opportunities is getting challenging. Making the effort to stay in touch with utility program managers and similar staffs can pay off handsomely, though - especially in situations where a region is seeing rebates or incentives for the first time, or where incentive programs are inadequately funded to meet pent-up demand and are quickly oversubscribed.
ACEEE's third Annual State Energy Efficiency Scorecard
One of the best sources of insight into the direction and magnitude of efficiency efforts in various parts of the country is the Annual State Energy Efficiency Scorecard that is published by the American Council for an Energy Efficient Economy (ACEEE). Since 2007, ACEEE has used the Scorecard to highlight best practices and recognize leadership among the states. Its most recent report - the third in as many years - was released in October 2009.Although ACEEE’s Scorecard ranks states individually, its “Summary of Rankings” opens with an important caveat: the difference between rankings is most significant among groups of every ten or fifteen ranks rather than between individual rankings. For example, if one were to sort the 50 states into five groups, each containing ten consecutively ranked states, one would find greater distinctions between, say, the first quintile and the second or third.
ACEEE’s Scorecard addresses six principal areas: 1) utility and public benefits programs and policies; 2) transportation policies; 3) building energy codes; 4) combined heat and power; 5) state government initiatives; and, 6) appliance efficiency standards.
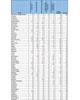
Figure
2. This table summarizes the scoring by state on
Utility and Public Benefits Programs and Policies in ACEEE’s 2009
State Energy Efficiency Scorecard.
(Source: 2009 State Energy Efficiency Scorecard, ACEEE.)
(Source: 2009 State Energy Efficiency Scorecard, ACEEE.)
Of the six principal areas considered by the Scorecard, the one that is the most relevant to this “Energy Incentives” column is the first: “Utility and Public Benefits.” Scoring in that area is actually a composite of five other scores: 1) spending on efficiency programs (electricity); 2) annual savings from efficiency programs (electricity); 3) spending on efficiency programs (natural gas); 4) targets (energy efficiency resource standards); and, 5) utility incentives and/or removal of disincentives. It’s important to note that the 2009 Scorecard uses program spending and energy savings results from 2007-year programs (the most recent data available from all states) and enabling policies (e.g., energy savings targets and performance incentives) as of September 2009.
Figure 2 shows the “Summary of State Scoring on Utility and Public Benefits Programs and Policies,” excerpted from Table 2 of ACEEE’s Scorecard.
Further Funding Increases Predicted
One of the most surprising findings featured in the ACEEE Scorecard originally appeared in a Lawrence Berkeley National Laboratory study titled,The Shifting Landscape of Ratepayer-Funded Energy Efficiency in the U.S. The authors of that study believe that ratepayer funding for electric and natural gas energy efficiency programs will rise from $3.1 billion in 2009 to between $5.4 billion and $12.4 billion by 2020. As one might expect, a large portion of this increased spending is expected to come from states that have been relatively minor players in the energy efficiency landscape to date (e.g., Illinois, Michigan, North Carolina, Ohio, and Pennsylvania).Another excellent source for estimating the magnitude and trajectory of efficiency dollars is the Consortium for Energy Efficiency’s (CEE) Annual Industry Report. That report has proved invaluable at helping industry observers track the steady ascent of efficiency budgets in the U.S. and Canada over the last several years. When comparing ACEEE and CEE data, however, one must remember that these two data sets are quite different. While ACEEE’s Scorecard tracks spending, CEE’s Annual Industry Report tracks budgets. And while ACEEE’s Scorecard addresses all 50 states plus the District of Columbia, CEE assembles its Annual Industry Report using a somewhat different set of data compiled with the help of its members and others parties.
For more detailed information about energy efficiency initiatives at the state level, visit ACEEE’s State Energy Efficiency Policy Database on the Web (www.aceee.org/energy/state/index.htm). The online database is searchable by state or by policy, and documents state activities in the energy efficiency policy areas covered in the Scorecard.
Additional information on CEE’s Annual Industry Report can be found athttp://www.cee1.org/ee-pe/2007/.ES


