
If you work in data centers, then the PUE matters to you. Look into some ways to reduce the cooling system’s power consumption, understand the impact of climate zone and size, and perhaps improve your facility’s benchmark along the way.
Recently, various organizations have pursued efforts to develop further understanding and benchmarking of data center energy efficiency. Numerous potential regulatory and institutional initiatives have driven these efforts. The U.S. Environmental Protection Agency (EPA) “Report to Congress on Server and Data Center Energy Efficiency” (2007/8) and the European Commission’s “Code of Conduct on Data Centres Energy Efficiency, Version 1” (2008) are only two examples of regulatory interest in data center efficiency.
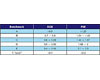
TABLE 1. An example of potential data center benchmarks.
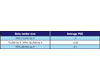
TABLE 2. Average power usage effectiveness (PUE) of various data center sizes.
THE METRICS SYSTEM
Perhaps the only practical metrics that exist are those developed by The Green Grid, an industry consortium active in developing metrics and standards for the IT industry. This article presents a summary of energy audit and optimization studies conducted on 25 data centers, including comparison of their power usage effectiveness (PUE) and data center infrastructure efficiency (DCiE). As shown in Figure 1, PUE is defined as data center total power divided by IT equipment power. PUE is always higher than unity, and the closer it is to unity the better the performance; its reciprocal, the DCiE, is a fraction or percentage. The higher the DCiE, the more efficient the data center is considered.Similarly, a mechanical PUE and electrical PUE can be defined. PUEmechanical is obtained by dividing the energy consumed by the mechanical infrastructure by the IT equipment power; this indicates the effectiveness of the HVAC system. PUEelectrical is defined as the total electrical power (electrical losses plus lighting power plus IT power) divided by the IT power. PUEelectrical results in a number that is larger than one. The lower this number, the more efficient the electrical infrastructure. Figure 2 depicts a summary of the annual average PUE obtained in various climate zones. (A combination of power measurements and data trends from a BMS was used to calculate these metrics.)

FIGURE 1. Data center components and PUE.
If one were to benchmark the 25 data centers in terms of a PUE according to the hypothetical criteria shown in Table 1, this would result in the following:
- “D” rating: 32%
- “E” rating: 36%
- “F” rating or poor: 32%
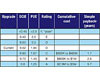
Table 3. Case study one. 1.Cumulative cost is the total costof all recommendations or energy-efficiency measures that arerequired to reach to the next rating level. For the example above,the rough order of magnitude (ROM) cost is $300k to $400k toincrease the DCiE from 0.52 (D) to 0.60 (C). Similarly, to increasethe rating from D to B, the cumulative ROM cost is $600K to $1M.2.Simple payback is calculated as the cumulative cost divided bythe projected annual energy savings.
Interestingly, the database indicated that small data centers (raised floor area [RFA] < 10,000 sq ft) illustrates this point. Small data centers were observed to have partially populated IT equipment racks and floors, oversized and aging cooling systems, higher levels of air mixing (recirculation and bypass air) in the raised floor areas, no implementation of free cooling, low UPS load factors, and no direct cooperation between the IT and the facilities departments.

TABLE 4. Case study two.
Generally speaking, energy efficiency measures required to upgrade a benchmark rating from “F” to “E” can be implemented with little or no investment; these measures have a quick payback. In many scenarios, those measures may even lift the rating to the next level, “D.” The typical low-hanging fruit that can be found by data center operators may include measures such as shutting down extra cooling units (beyond design redundancy) due to overcooling, widening humidification tolerances, raising air temperature setpoints in cooling units, disabling reheat elements, installing blanking panels, and sealing floor cut-outs with cable brushes to improve air management. However, substantial investments are necessary to achieve high benchmark ratings.

FIGURE 2. Average annual PUE of data centers in various climate zones.
CASE STUDY ONE
Case study one (Table 3) is a 1 MW IT load (30,000 sq ft of raised floor) data center in climate zone (5A) rated currently at DCiE=0.52, PUE=1.94 “D.”Table 3 is represented in Figure 3. It shows that the cost to upgrade will increase but not necessarily linearly. Upgrading to ratings “B” and “A” will require substantial investment.

FIGURE 3. PUE improvement for case study one.
CASE STUDY TWO
Case study two (Table 4) is a 200-kW IT load (22,000 sq ft of raised floor partially populated) data center in climate (4A) rated currently at DCiE=0.35 (PUE=2.86 or F “poor”)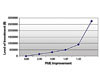
FIGURE 4. PUE improvement for case study two.
CLIMATE IMPACT
The effect of climate zone on energy efficiency is also important. Figure 5 is derived from actual data, and the impact of climate zone is clearly evidenced. Zone 1 is the hottest, and 7 is the coldest, (Zones 6 and 7 are not shown as there were no data from data centers in those two zones). In addition, the zone designation includes an alphabetic designation: Here A stands for moist, B stands for dry or desert, and C stands for marine conditions. For example, Chicago is Zone 5A while Miami is 1A. Colder climate zones offer potential for “free cooling directly via an air economizer or indirectly via a waterside economizer, which can provide substantial reductions in mechanical power consumption and improved PUE.Operators of a data center in Phoenix (Zone 2B) may have limited options for lowering PUE than operators of a data center in San Francisco (3C). The high year-round ambient temperature in Phoenix makes it more difficult to make use of energy-reduction strategies such as economizers and VFDs.
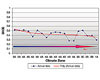
FIGURE 5. Climate zone impact on data center energy efficiency.
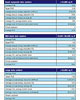
TABLE 5. Summary of data center energy audits.
LOW PUE DATA CENTER
n general, low PUE data centers will have efficient cooling systems and use airside economizers outside air for cooling or waterside economizers with VFDs on every possible component. Additionally, those data centers will have high chilled water setpoints, high servers intake air temperatures, and wide humidification ranges. Finally, those data centers will have completely enclosed cold or hot aisles or physically isolate the two to separate cool air from warm air. On the electrical side, these facilities will have an uninterruptible power supply (UPS), load factors of 40% and associated UPS efficiencies higher than 96%, and perhaps occupancy sensor-controlled lighting systems.
FIGURE 6. Data center average power consumption.
Generally speaking, the power allocation in a typical data center (PUE~2) is shown in Figure 6.
Aside from the IT equipment power, Figure 6 reflects the fact that most energy-efficiency measures can be implemented in the mechanical cooling system whereas limited options are available for the electrical infrastructure. Mechanically, the cooling system and the data center fans represent the major energy consuming components, while the UPS and the lighting systems are usually the only areas where gains can be made practically in the electrical system. The cooling load can be reduced by implementing economizers and VFDs on the chillers, and by raising the chilled water setpoints and implementing condenser water reset control as weather permits. Similarly, implementing variable airflow can reduce the fan power consumption by up to 40%.
GENERAL CONCLUSIONS
The analyses in Table 5 were based on a fixed cost per kWh. Cost of power varies between the different geographical areas. In Boston, which is located in Zone (6A) for example, the cost of electricity is $0.16/kWh, whereas the cost in Phoenix (Zone 2B) is $0.08/kWh. Additionally, some parts of the U.S. have more green power than others. The green power plants (wind, solar, etc.) result in less associated carbon footprint. The data centers in the database were grouped into three different categories based on their size. For small data centers, reduction of the PUE from 3 to 2.3 would require small investment of about $165K, which would be paid back in about 3 years and that would result in 300 metric tons of carbon dioxide avoidance. Further analyses are shown in Table 5 for other categories.ESREFERENCES
United States Department of Energy (DOE). U.S Government Computer News.http://www.gcn.com/online/vol1_no1/46419-1.html, 2008.United States Environmental Protection Agency. Report to Congress on Server and Data Center Energy Efficiency Public Law 109-431, ENERGY STAR Program, 2007.
U.S. DOE. Save Energy Now Initiative.http://www1.eere.energy.gov/industry/saveenergynow/partnering_data_centers.htm, 2007.
European Union Code of Conduct for Data Centres.http://re.jrc.ec.europa.eu/energyefficiency/html/standby_initiative_data%20centres.htm, 2008.
The Green Grid. “The Green Grid Data Center Power Efficiency Metrics: PUE and DCiE.”http://www.thegreengrid.org/gg_content/TGG_Data_Center_Power_Efficiency_Metrics_PUE_and_DCiE.pdf, December 2007.
