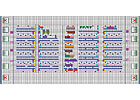
FIGURE 1. Typical data center module.
Here in the second of two parts, the author is reminded that data center design is no vacation. He does, however, discover that what doesn’t work on the road to Orlando doesn’t work in the data cen-ter, either. What to do? Truly isolating the heat at its origin and backing around to a classic VAV pressure reset strategy eventually yielded a cool solution for everyone not working in the hot aisle.
If you have ever been a parent on a family road trip in any vehicle smaller than a bus, you know the value of separation. It’s a tired cliché, but I think we have all found ourselves yelling to the back seat something like, “I swear on all that is holy, if you two don’t stop bugging each other, I’m going to turn this car right around!”
The last time this happened to me, I was just south of Atlanta pulled to the shoulder on I-75 en route to the “Happiest Place on Earth.”

Figure 2. CFD with cold air in the hot aisles, no ceiling plenum, and no hot aisle containment.
Similarly, all too often we draw invisible lines in our HVAC designs and assume (or hope) that noth-ing will cross them. A perfect example of such wishful thinking is the hot aisle/cold aisle demarcation that has become standard design practice in data centers.

FIGURE 3. Underfloor performance with four units off.
Some Background
Last month, I wrote about the 70,000-sq-ft data center project that Jacobs’ St. Louis Data Center De-sign Team was fortunate enough to be a part of. To recap, we were looking at a data floor the size of a football field with an average power density at 100-plus W/sq ft. We implemented a 2,700-ton vari-able primary chilled water plant with air cooled chillers and dry coolers for economizer savings.Because of security and operational concerns, locating traditional computer room air conditioning (CRAC) units within the data hall proper was not an option. Therefore, we would have to locate the CRACs outside the computer hall, or as it is commonly referred to, the raised floor area (RFA). We found that the air throw limits of traditional CRACs (about 50 ft and the associated architectural re-straints, specifically a RFA with a maximum width of 100 ft, were impractical.
Instead, larger custom AHUs would be employed that could provide the volume and throw necessary to serve the nominal 200-ft-by-400-ft contiguous RFA. These AHUs would provide air to the data hall via a 42-in. underfloor plenum and a hot aisle/cold aisle configuration, with the aisles perpen-dicular to the equipment corridors (Figure 1).
The original concept design, which was developed by another firm, called for the return air to travel back to the mechanical galleries through the RFA with no return plenum or ductwork. Further, one perforated tile was provided in the hot aisles for every four placed in the cold aisles, giving us an 80/20 split. The concept designer’s belief was that the cold air plumes in the hot aisles would, in ef-fect, assist the hot air, carrying it higher and in turn avoiding recirculation into the cold aisles as it made its way back to the intake grilles on the data hall perimeter.
Unfortunately, this concept was predicated on two imaginary and impenetrable planes: The vertical planes enclosing the hot aisles, and the horizontal plane between the cold aisles and the return air path above.
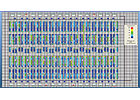
FIGURE 4. CFD with a ceiling plenum but no hot aisle containment.
The First Model
Now when Jacobs picked up this design, we were skeptical about the air delivered in the hot aisles. Further, while we had some questions about the distribution effectiveness of the relatively wide un-derfloor supply plenum, we had serious reservations about the hot air returning across that great di-vide (and across all of those racks) without causing problems. So we recommended that a computa-tional fluid dynamic (CFD) study be commissioned to determine if this novel concept would actually work.The Jacobs Portland Data Center Design Team was called upon to electronically mock up the space using the Tileflow program developed and supported by IRI (www.inres.com). A representative mod-ule was modeled including underfloor obstructions and a 0.2% leakage rate. Tate Grateaire™ high-capacity perforated tiles were included, and the AHU outlet temperature was set at 59°F. The maxi-mum cabinet inlet temperature was allowed to be 75°. Based on the full build-out load of approxi-mately 7.0 MW and the required redundancy, the individual AHU capacities were set at 32,500 cfm.
All of these parameters would apply to the subsequent runs as well.

FIGURE 5. Elevation with ceiling plenum and no hot aisle containment.
And that is key. Historically, data center spaces have been addressed as any other space. Total cfm can be calculated from total load based on average space temperatures and a fixed DT. It is all too common to control off return air temperature like many other air-handling systems, and that just makes no sense in a data center.
Specifically, it is the inlet temperature at the rack that matters. It is the airflow and delivery in the cold aisle that has to be optimized. It is the hot air on the rack’s back side that has to be isolated. And it is the DT across the servers you design to. It’s not a room-scale solution you are looking for; at the very least it’s a pod solution, and if we’re honest with ourselves, in actuality we need answers at the rack level.
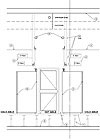
FIGURE 6. Hot aisle containment prototype.
Take Two
So round two commences, and the first step is to check off what we consider the best practice boxes. There were a couple interim iterations, but ultimately, among other things, we removed the tiles from the hot aisles, made some adjustments on tile placement in the cold aisles, and provided a return ple-num. By the way, an excellent resource that discusses these best practices and others is the high-performance data center design guide developed by Pacific Gas and Electric (PG&E) in conjunction with Lawrence Berkeley National Lab (LBNL). It’s showing its age a bit being issued in 2006, but the basic tenets it espouses are still sound.It’s worth mentioning that the underfloor pressure profile across the 200-ft expanse was not a prob-lem. Even when we modeled failure mode (four out of 32 units off), the pressure was reasonable throughout (Figure 3).
But we were still having problems with the air ignoring our imaginary demarcations (Figures 4 and 5). With performance vastly improved over the initial concept, we were still seeing a nominal 20% failure rate at full build out in both normal and failure modes. Note again, however, that the failure rate was not significantly more in failure mode than normal mode (20% vs. 21%) due to the excellent characteristics of the underfloor distribution system.
That pesky hot air was coming over the cabinets and around their corners. The problems were varied, but interestingly enough we were seeing most issues at the second row of pods on each side, not the center of the RFA. With a relatively low initial failure rate and some consistency in the type and lo-cations of the failures, with some tweaking and optimization, (load balancing, diffuser placements, adjusting row lengths, etc.), we could likely get the failure rate down by half. But failure is failure. If you don’t believe me, just ask the IT professional which 10% of his racks he can live without. Be prepared for an awkward silence.
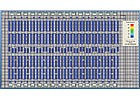
FIGURE 7. CFD with a ceiling plenum and hot aisle containment.
Imagine Not Imagining
With all due respect to the late John Lennon, imagine there are no imaginary boundaries. Just boot those figments out of the data center altogether. That’s what we did and what we modeled. In par-ticular, we replaced the imagined boundaries with physical boundaries (Figure 6). Using materials and practices perfected by our Portland folks who were working on much higher density data centers (600 W/sq ft plus), we developed a solution that was more appropriate for our commercial client and their lower watt densities (read less expensive).The results were stark but not surprising (Figures 7 and 8). With the hot air having nowhere to go ex-cept back into the plenum, short circuiting was eliminated. And with no hot air in the RFA proper, the temperature in the cold aisles, which in turn was the temperature at the rack inlets, was roughly the AHU supply temperature.
My favorite reference is Figure 8, which I referred to as the Blue-T Diagram (pretty original, eh?). The performance was so clear that it’s hard to convince the casual observer that it isn’t too optimistic. And in reality, the real world is always different from the model, but hey, the model had zero failures. That’s a design you can hang your hat on.
All that Blue Leads to Green
Perhaps the most valuable aspect of the full separation concept is that in addition to simple perform-ance, it leads to so many opportunities to save energy. First, there is the obvious fact that if you are mixing air as with a design with no separation, you have to overcompensate to provide enough cool-ing. That’s no longer in the equation in a full separation design.If what you deliver is what you get in the cold aisle and the entering rack temperature needs only to be in the range of 70°, then you can reset your AHU supply temperature up from the more traditional 55° or 60°. Reset supply temperature, and you can reset chilled water temperature. Reset chilled water temperature, and you increase chiller efficiency and open the economizer window that much wider (see last month’s discussion).
Higher supply temperatures mean less, or more likely, no dehumidification. Units aren’t fighting each other, reheat is eliminated, and the energy and environmental costs of re-humidification are eliminated.
If you can isolate the hot aisle, you can theoretically raise the temperature in that hot aisle with no ef-fect on the data center proper. If that’s the case, you can raise your airside DT, which leads to less air-flow and fan energy savings. And not only are the controls relatively straightforward, they provide additional fan energy savings through variable flow on the airside.
Specifically, think of the rack pods as individual entities that literally pull the air they need from the cold aisles via their individual server fans. Remember, unless you are directly connected to the rack as with chimney cabinets for example, your AHU or CRACs are not pushing or pulling air through the racks. They are pushing air to the cold aisles and pulling air from the hot aisles. The DP through the rack and server is handled by the equipment residing within it.
With separation, you then only need to provide the air needed by the server fans. In turn, what you experience in the cold aisles is a varying pressure caused by this continually varying draw. You may ask, “How do you control with this variable in play? A variable you have no control of?” Well, I’ll tell you: with good, old-fashioned barometric dampers with end position switches.
Throughout the RFA proper there are a number of barometric dampers. As the server fans back off and because the AHUs fans have not, the pressure increases in the cold aisles. Subsequently, the dampers open wider. As the dampers open wider, it is an indication that the AHUs can back down and deliver less air. As the AHU backs off, the pressure begins to normalize again and the dampers start to close. What you then can do is control the AHU VFD to modulate the dampers to ensure that only one damper is open to a minimum position. And there you have it: a classic VAV static pressure reset strategy that is fully decoupled from the server fans.
Nothing is Perfect
This strategy, while appropriate for our data center, may not be right for others. One of the challenges associated with the concept may be increased first cost, depending on the materials and practices em-ployed and the alternative solutions being considered. Another “opportunity” is a decrease in flexibil-ity. Depending on the design employed, moving or changing pods may be a challenge.Also, there will likely be paradigms that must be overcome when it comes to what people expect a data center to look and feel like. When separation is employed, the room is broken up. If the cable management is properly coordinated this isn’t a problem, but it looks different. Also, equipment or operations that don’t lend themselves to the traditional pod configuration, like tape storage for exam-ple, require a slightly different approach.
Further, the cold aisles are likely warmer than folks are used to. And what probably is a bigger deal is that the hot aisles are really hot aisles. With the full enclosure, the temperature in the hot aisle con-tainment area is the temperature leaving the racks, and that may be as high as 90° to 100º, depending on equipment specs and your chosen DT. Again, this isn’t a problem as far as the equipment is con-cerned, but you tell that to the tech working in the back of the rack.
Like I always say, consider this option along with all of the other great ideas out there. There are a number of ways to skin the cat, and the art and science of data center design continues to evolve. But you have to admit all that blue looks nice.ES

