
From AHUs to new chilled water loop management to lighting and life safety, the upgrades to these two state office buildings were as numerous as they were effective. However, this story is especially notable for the analysis that led to the project decisions - including omitting a couple of innovative options for cost - and the verification that confirmed the payoff. Thus, this handsome Tennessee couple not only save money but also serve as role models.
In response to high energy costs - averaging $3.09/sq ft/yr - the State of Tennessee contracted with Architectural Energy Corporation (AEC) to provide baselining services and energy conservation measure analysis for its Andrew and Rachel Jackson state office buildings. AEC performed an investment-grade audit of both buildings, including the development of calibrated building energy simulation models and short-term diagnostic monitoring of the building systems, as well as commissioning and measurement and verification services.
Analysis of subsequent utility bills for FY05 and FY06 during the measurement and verification effort resulted in an average annual energy cost savings of $632,048, or a 42% reduction in overall building utility costs.
Setting The Stage
The State of Tennessee Department of General Services oversees the operation and maintenance of 130 state-owned facilities. The department upgrades facilities through projects managed by the Department of Finance & Administration. In 1999, the State Building Commission approved an energy management plan for new and existing state-owned buildings. A key element of this plan is the use of energy saving performance contracts to identify and implement viable energy conservation measures (ECMs).Two of the initial targets selected under this energy management plan were true energy hogs, the Andrew and Rachel Jackson state office buildings located in downtown Nashville. Built in 1970, these buildings were equipped with constant-volume air distribution systems, and utilized an out-of-date BAS that was known to give many false readings, resulting in much of the equipment being placed in “hand.” The lack of system flexibility and controllability resulted at the time in annual energy costs of $3.09/sq ft, making these buildings exceptional candidates for improved energy performance.
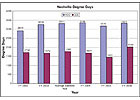
FIGURE 2. Nashville heating and cooling degree days.
In support of this project, a detailed energy study of the buildings was performed by AEC in 2000, and a follow up study performed in 2003. These detailed energy studies involved short-term monitoring using remote datalogging equipment and diagnostic analysis of the buildings’ lighting and HVAC systems, and identified various ECMs for both buildings.
Detailed DOE-2 energy models were developed for each building, using information obtained during the audits, as well as observations made from the monitored data analysis. The energy models were calibrated by comparing the model outputs to historical utility billing information and making changes in the models to reflect the historical energy use of the buildings. The calibrated models were then used to estimate energy and cost savings associated with the proposed ECMs. Estimated implementation cost estimates were also developed at the time to determine the economic impact of the proposed measures.
A subset of the ECMs analyzed in the energy studies were selected for implementation. The design drawings for these measures were developed by Allen & Hoshall, and the measures were then implemented primarily by The Comfort Group and Siemens, with assistance from Stones River Electric and with TVA acting as the project manager. In support of this implementation process, AEC performed commissioning services on all of these ECMs, which involved design and construction document review, jobsite observations, diagnostic monitoring, and FPT, to ensure that these measures were installed properly and according to the design intent.
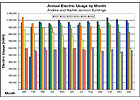
FIGURE 3. Total annual electric consumption by month.
Building Systems
The 18-story Andrew Jackson building and the nine-story Rachel Jackson building comprise primarily a mixture of open and private office space, with other spaces such as a mail room, printing facilities, a cafeteria, lobbies, a parking garage, computer server rooms, and other miscellaneous support spaces.Both buildings are provided chilled water and steam from the district Nashville Thermal Transfer Corporation (NTTC), and both chilled water and steam/hot water (converted via a heat exchanger) are distributed to both buildings primarily via the pumping system located in the Andrew Jackson building. The NTTC service enters the building in the basement, and runs up to the penthouse to tie into the existing chilled water loop.
This results in all the chilled water being pumped up to the penthouse with a 100-hp pump and then pumped back down to the induction units and other air handlers located throughout the building (using the existing distribution pumps). The original cooling plant, located in the penthouse of the Andrew Jackson building, was abandoned in place in favor of this district-fed system.
Cooling-only, constant-volume AHUs, located on each floor of the Andrew Jackson building, provide conditioned air to the interior spaces. The perimeter spaces are served by 128 four-pipe induction units that provide heating and cooling as well as outside air ventilation for each floor. An air handler on the 16th floor provides preheated outside air to these perimeter induction units. Six heating and cooling constant-volume AHUs also serve the basement and ground floors of the building.
Constant-volume AHUs, located on each floor of the Rachel Jackson building, provide HVAC to the spaces. Three AHUs also provide HVAC to the basement and first floor. All of the floors, with the exception of the ground floor and basement floor, also have four-pipe fancoil units around the perimeter that provide additional heating and cooling to the perimeter zones. These units are, for the most part, individually controlled by the occupants.
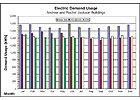
FIGURE 4. Annual electric demand by month.
Energy Conservation Measures
The analysis of the short-term monitored data identified and helped to establish baselines for a number of ECMs. As previously described, these ECMs were analyzed using detailed DOE-2 energy simulations, and their estimated economic performance was used to develop a package of measures to be implemented as part of this project. The measures selected for implementation included the following:- Lighting lamp and ballast replacement from T-12 / magnetic to T-8 / electronic
- Lighting controls: DDC scheduling and integration with the proposed DDC HVAC system, occupancy sensors, and daylight harvesting
- Installation of a comprehensive DDC EMS (HVAC and lighting controls)
- Conversion of the constant-volume chilled water and hot water loops to variable-flow
- Re-ducting the outside air intake, and reduction of incoming outside air quantity through the introduction of return air into the makeup air system, while maintaining IAQ requirements
- Elimination of simultaneous heating and cooling in the makeup air system
- Refurbishing the perimeter induction units and installing hot water and chilled water floor isolation valves, as well as perimeter ventilation air isolation dampers for each floor
- Conversion of the six AHUs serving the basement and ground floors to VAV operation with VFDs
- Some duct re-configuration
- Economizer operation added to the main makeup air unit serving the perimeter induction units
- Conversion of all core AHUs to VAV with VFDs
- Perimeter fancoil units converted from pneumatic standalone control to networked DDC
- Window film application
Other measures were considered but eliminated from the project for various reasons. For example, conversion of the cooling-only, constant-volume AHUs serving the interior spaces of the Andrew Jackson building was considered. However, extensive costs associated with this retrofit made the simple payback period unattractive.
Additionally, two water cooled centrifugal chillers and two cooling towers located in the penthouse that originally provided the chilled water for the buildings had been abandoned in place in favor of chilled water purchased from NTTC. Significant increases in chilled water costs from NTTC suggested that installing new chillers and refurbishing the cooling towers could be an option. However, this was determined to be impossible due to existing contractual obligations with NTTC.
As one of the recommended energy conservation opportunities associated with this original plant, it was proposed that the towers be refurbished and coupled to the chilled water loop via a heat exchanger, to provide chilled water during favorable ambient conditions. However, estimated costs for the implementation of this measure suggested that this would be prohibitively expensive.
Innovation
One of the major design elements of the Andrew Jackson building is a single AHU designed to deliver 60,000 cfm of outside air to the perimeter induction units. This unit represents the largest individual energy load in the building and is likewise the most critical unit in terms of control and management of the building envelope.This unit was originally designed for 100% outside air; Allen & Hoshall proposed a creative design that established a return air path that allowed for an airside economizing opportunity. This initiative generated significant energy savings and dramatically improved airflow in the lower half of the building.
The unit’s control sequence is both sophisticated and simple, beginning with an automated reset of discharge air temperature for optimum environmental control and efficiency. The control sequence goes well beyond the standard economizer on/off, integrating all design elements (dampers, valves, pumps, fan speeds) into a staged sequence for maximum efficiency, and specifically eliminating simultaneous heating and cooling.
The Rachel Jackson building has perimeter fancoil units to satisfy the exterior building envelope load. These fancoil units were integrated as part of this project into the new DDC system, and the central floor air-handling system now monitors the fancoil unit zones, as well as its own zone temperature sensors, to optimize the discharge air temperature and AHU airflow. This control strategy satisfies the temperatures in both the interior and perimeter spaces simultaneously, and minimizes any overcooling at the AHU and subsequent reheating by the fancoil units. It is a very integrated control scheme that provides only as much heating or cooling as needed to maintain the space temperature setpoints.
The lighting control system in both buildings is integrated into the HVAC DDC systems as well. This allows for integrated scheduling and after-hours use for both the lighting and HVAC systems. Each floor has a lighting override panel located in the elevator lobby that occupants and custodial staff can use to enable lights and A/C in their zone, so that only the minimum amount of equipment necessary to maintain lighting and occupant comfort is operated during normally unoccupied hours of operation.
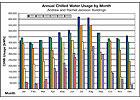
FIGURE 5. Chilled water usage by month.
Measurement and Verification
In support of the energy saving improvements performed at these two buildings, AEC has performed measurement and verification (M&V) services on an annual basis, for two years since these measures were installed and commissioned in 2004, to verify the actual energy and cost savings achieved by this project. The M&V plan developed for these buildings provided a systematic procedure for determining the energy savings resulting from the implementation of the selected ECMs. The International Performance Measurement and Verification Protocol (IPMVP) provided the framework for this plan. Under the direction of the State of Tennessee Department of Finance and Administration, IPMVP Option C, Utility Bill Analysis, was used to quantify the energy and cost savings for each fiscal year (July through June).For the savings calculations determined from the actual energy bills, adjustments to the energy savings were made based on the comparison of the heating and cooling degree days during the baseline and post-retrofit periods, to present a more unbiased weather representation of the energy savings being realized.
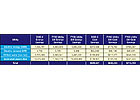
TABLE 1. Savings for fiscal years 2005 and 2006.
Data Collection
The annual electric consumption baseline was calculated using a combination of data from the electric meters, a load profiler website, and utility data used in the original energy study. Daily usage data from these sources for January 2001 to February 2003 was used to calculate an average daily baseline usage. Electric data was collected from the load profiler website to determine savings for the time period of July 1, 2004 to June 30, 2006. Maximum monthly demand data were obtained from utility billing data compiled by the State of Tennessee Department of Finance and Administration.One issue that arose during the analysis dealt with the fact that, although a new steam meter had been installed for the two buildings as part of the retrofit project, problems with the data collection and calibration of the meter resulted in incomplete or unreliable data for the specified time period. Therefore, for the analysis performed for these two years, steam consumption data were obtained from the utility billing data compiled by the State of Tennessee Department of Finance and Administration, available in monthly increments.
Unfortunately, this consumption data is collected by a common steam meter used to monitor steam usage for several downtown state buildings, including both Andrew Jackson and Rachel Jackson. As a result, steam usage for both buildings is apportioned by using a square footage assignment made by the General Services Administration. Therefore, while steam consumption for the buildings has decreased due to the retrofits, apportioning the steam consumption among all these buildings essentially “washes out” some of these savings, making it difficult to accurately account for the true steam savings being realized. In an effort to account for this issue, certain conservative adjustments were made to the calculations in an attempt to reduce this washing out effect.
Weather Influences
Figure 2 illustrates the heating and cooling degree days for Nashville. Although the average baseline year and FY05 and FY06 have similar heating degree days over the entire year, there are variations in the number of heating degree days when compared on a monthly basis. Due to the variations of heating and cooling degree days between FY05, FY06 and the average baseline year, adjustments were made to the energy savings calculations. The results were subsequently presented showing the results with the corrections for weather influences.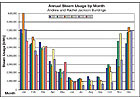
FIGURE 6. Steam usage by month.
Verified Savings
The analysis of the utility bills resulted in the energy and cost savings presented in Table 1 for FY05 and FY06, as well as the original energy savings estimated during the detailed energy study. The savings for FY05, particularly the electric and steam savings, were lower than estimated in the energy study. This was primarily due to the fact that all of the systems had not been completely commissioned during that time period, and after-hours overrides were more frequent than originally estimated (as was the case for the lower electric savings in FY06 as well).Overall, the results indicate that the average energy cost savings resulting from this project averaged $632,048, or 97% of the original estimated energy cost savings, and represent a 42% reduction in overall building utility costs. The total cost of the implementation of the measures, which included non-energy saving upgrades such as a new emergency sprinkler system, was approximately $4,000,000, for an overall simple payback period of about six years.
One of the far-reaching benefits of this project is that the verified savings each year are put back into the operating fund for the department of Finance and Administration, to fund additional energy projects. Thus the economic benefit to the state is sound, and this project helps to perpetuate additional energy savings for the state as additional energy efficiency projects are applied to state buildings. Energy savings are verified through the M&V process each year, for the first five years, to ensure that energy savings persist.
Not only does this project help fund additional projects such as this one, since these are state buildings with a high public profile, they represent a beacon of energy efficiency, raising the awareness of the general public about the potential and benefits of energy efficiency and retrofit projects.ES
