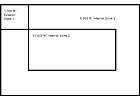
FIGURE 1. Facility floor area and zoning for a 20,000-sq-ft facility with 10-ft high ceilings.
The central thrust of this article is to present the results of transient concentration response analyses to undesirable contaminant releases in the vicinity of the outdoor air (OA) intake, or directly into occupied zones. In the analyses, it is assumed that a facility is served by either an all-air VAV system or a DOAS. Filtration efficiency is varied in the analyses to reflect the potential for different filter efficacies, depending on the contaminant released.
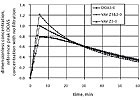
FIGURE 2. Transient dimensionless concentration from release near OA inlet with filter efficiency of 0%.
DOAS And Safety
The DOAS delivers 100% OA to each individual space in the building via its own duct system at flow rates generally as dictated by ASHRAE 62.1-2004 or higher. Elevated design ventilation flow rates may be necessary for latent load control, or to garner LEED® green building points. Based upon the requirements of ASHRAE 90.1-2004, most DOAS applications require the use of total energy recovery. As a general rule, a DOAS operates at constant volume during all occupied hours.Consequently, for most applications, the DOAS is not capable of meeting all of the thermal loads in the space by itself, and requires a parallel system to accommodate any sensible and latent loads it can’t accommodate. The DOAS is not to be confused with what is commonly called a 100% OA system, whose flow rate is selected to meet the entire building sensible and latent loads. In other words, a DOAS generally delivers only about 20% as much air to a space as a 100% OA system.
The thermodynamic state of the delivered air varies, but as a minimum it should condition the air to the desired space dewpoint temperature (DPT), thus decoupling much of the latent load from the parallel system charged with the bulk of the space sensible load control.
From a security point of view, the constant volume DOAS leads to predictable pressure differentials (including neutral, if desirable) between adjoining spaces or zones, thus minimizing the potential for interzonal transfer of airborne material. Also, since it does not use any recirculated air, airborne material that may be present in one zone is not immediately distributed throughout a facility by the mechanical system as is common with mixing air systems (such as VAV). Finally, since the volume of air introduced into the building, in most cases, is only about 20% that of all-air mixing systems equipped with air side economizers, the first cost of OA filtration/treatment equipment (even with an improved efficiency rating) and associated added fan energy is less.
The selection of the parallel system for security is important. From that perspective, the best choices in order of safety are:
- Chilled ceilings (no air movement)
- Active or passive chilled beams (local in zone air movement only)
- Fancoil units
- Water-source heat pumps (WSHP)
- Other packaged terminal equipment
Many configurations are called DOAS, but they are certainly not all as described above.
DOAS and displacement ventilation (DV) are often confused as competitors. In its original conception, DV provided conditioned OA introduced at low velocity at floor level. Under that definition, DV could be viewed as a delivery vehicle just as a high induction overhead ceiling diffuser is. And either could be served by a DOAS.
A rich source of information about DOAS can be found athttp://doas-radiant.psu.edu.
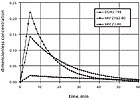
FIGURE 3. Transient response to a release near the OA intake, with 80% VAV filter efficiency. DOAS filter efficiency is 98% for the same 60-min space concentration.
The Facility And Assumptions For The Analyses
Consider a 20,000-sq-ft facility with 10-ft high ceilings (Figure 1) consisting of a two-zone perimeter region: 1,000-sq-ft Zone 1 and 9,000-sq-ft Zone 2, respectively. The facility also has a large interior 10,000-sq-ft Zone 3. For the sake of the illustration, the following air-flow rates will be used in the analysis:- Perimeter Zones 1 and 2 each receive 1 cfm/sq ft of supply air via a shut-off box VAV system (herein referred to as a VAV system)
- Interior Zone 3 receives 0.6 cfm/sq ft of supply air via a VAV system
- OA flow for both the VAV and DOAS cases is 4,000 cfm, which is an average of 0.2 cfm/sq ft
- Total supply air for the facility: 16,000 cfm for a VAV; and 4,000 cfm for a DOAS
The analysis is based upon the following additional assumptions:
- Well-mixed zones (i.e., uniform concentrations)
- No interzonal transfer (e.g., neglect influence of pressure differentials, human activity, and or infiltration/exfiltration)
- CBR contaminants stay suspended (i.e. they do not settle or plate out in the zone)
- VAV system is analyzed while operating in the minimum OA mode, and at the design supply airflow rate (i.e., 16,000 cfm). Releases during full economizer mode (resulting in very high peak space concentrations when releases occur near the OA inlet) will not be presented due to space limitations
- The capacitance of the duct system, and its associated influence on the transient response, is neglected
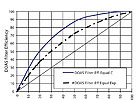
FIGURE 4. OAS filter efficiencies for releases near the OA intake match the space concentration or exposure after 60 min compared to the VAV filter efficiency.
Cases Considered
Releases into the OA intake and within individual zones are analyzed. The specific cases include:- The release into the OA stream is assumed to be of 5-min duration and of equal concentration for both the DOAS and VAV cases. This implies that the release is in the proximity of, but not directly into, the OA louver. The filters are assumed to be in the mixed airstream for the VAV system, and in the OA stream for the DOAS.
- Interior releases occur in the 1,000-sq-ft perimeter Zone 1 or the 10,000-sq-ft interior Zone 3. The releases inside the building are assumed to instantaneously and uniformly elevate the impacted zone concentration. This assumes that the initial zone concentration is fixed, but the volume of the release is different for the two different size zones. Filters have no impact on the concentrations for the DOAS with internal releases since there is no recirculation.

FIGURE 5. Transient response to a contaminant release into Zone 1 at 0% VAV filter efficiency.
Releases Near The OA Intake
Filter efficiency can significantly affect the peak concentrations and transient response of the zone concentrations when the release is near the OA intake. Space does not permit a thorough presentation of a full range of filter efficiencies, but upper and lower boundary conditions will be presented.First, consider the case where the filters have no impact on contaminant removal, e.g., 0% filter efficiency. Figure 2 illustrates such a case, with the release near the OA intake. Since the VAV supply air quantity to the exterior Zones 1 and 2 is higher than that of the interior Zone 3, their peak concentrations are different.
For the DOAS, since the supply airflow rate is a constant 0.2 cfm/sq ft, the peak concentration in all zones and the subsequent response is uniform throughout the facility. Note: The zone transient concentrations are presented in dimensionless form, referenced in all cases to the peak concentration experienced by the DOAS with 0% filtration efficiency. Since the VAV supply airflow rates differ between the interior and perimeter zones, their peak concentrations differ (with the higher flow/sq ft perimeter zones exceeding that of a DOAS by 20% and the interior zone lower than DOAS). The higher VAV supply airflow rate to Zones 1 and 2 not only cause their peak concentrations to be higher than that of the interior Zone 3, but it also causes them to clear faster than the interior Zone 3.
Regarding security issues, one may frequently assume that the filtration efficiency used with a VAV system and a DOAS are equal. That need not be true. And if the filtration efficiency for a particular contaminant is 80% for a VAV system, the zone concentrations after one hour for both the VAV and DOAS are equal if the DOAS filter efficiency is 98% as illustrated in Figure 3. The area under the curves represents the exposure the occupants of the zones would experience.
It is significant to note that with the improved DOAS filtration efficiency, the exposure one hour after the release is about 425% more in the facility served by a VAV system when compared to a DOAS system. This is true since the 98% filter in the DOAS OA path removes 98% of the material before delivering it to the space. So even though it clears slower than the VAV system, its peak concentration is only 2% of what it experiences without a filter.
For the facility used in this analysis and associated assumptions, it is easy to compute the DOAS filtration efficiencies necessary to match the lowest 60-min VAV zone concentration and exposure (Figure 4). Notice the VAV and DOAS filtration efficiencies match at 0% and 100%. Otherwise, the DOAS filter efficiency must be higher than the VAV for equivalence. Finally, the DOAS filter efficiency necessary to match 60-min exposure is less than that necessary to match the 60-min concentration.
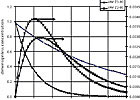
FIGURE 6. Transient concentration response to a release in Zone 1 with 80% VAV filter efficiency.
Releases in the 1,000-sq-ft Exterior Zone 1
Because there is no recirculation, an interior release to a facility served with a DOAS, under the bounding assumptions made for these analyses, has no impact on any of the adjoining zone concentrations. Quite a different situation develops for the same facility served with a VAV system. A release in Zone 1 will cause the contaminant to be mixed with OA, pass through the filter, and be delivered to all building zones - including Zone 2 and 3 initially not contaminated.This situation is presented in Figure 5 for 0% filter efficiency (all filter discussion is with regard to VAV since filter efficiency for internal releases has no impact on DOAS performance). The dimensionless (referenced to room concentration at time zero plus) peak concentration is the same in Zone 1 for both the VAV and DOAS. However, since the VAV system is able to disperse the contaminant to the entire facility, the exposed zone concentration is diluted quicker than that of a DOAS.
As a result of the VAV system dispersion, the concentrations in Zone 2 and 3 elevate quickly, reaching a maximum after 15 to 20 min, or about ± 2.5 % of the peak concentration in the Zone 1 release.
With a VAV filter efficiency of 80%, as illustrated in Figure 6, the concentration in the Zone 1 release drops rapidly for the VAV when compared to the DOAS. Likewise, the concentrations in the initially clear Zones 2 and 3 experienced the contaminant, but at significantly lower levels than with no filter. Their concentration reached a max of about 0.3 to 0.4% of the peak concentration in Zone 1, and cleared faster.
Since the release was in the small Zone 1, the amount of the contaminant to disperse was small.
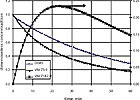
FIGURE 7. Transient concentration response to a release in Zone 3 with 0% VAV filter efficiency.
Releases in the 10,000-sq-ft Interior Zone 3
If a contaminant were released in Zone 3, its dispersion via the VAV system to Zones 1 and 2 would result in identical concentration transients in those zones since the supply airflow per unit of floor area to them is equal. With zero VAV filtration efficiency, as shown in Figure 7, the contaminated Zone 3 does not clear significantly faster than that of the DOAS, even as it is dispersing the contaminant to Zones 1 and 2. And, as the single transient concentration curve representing those zones shows, the concentration reaches a maximum after about 25 min. The maximum is about 25% of Zone 3’s peak concentration - that may still be an unsafe level!Improving the VAV system filter efficiency to 80%, as illustrated in Figure 8, causes the contaminated Zone 3 to clear much faster than can be achieved with DOAS. And as the single transient concentration curve representing those zones shows, the concentration reaches a maximum after about 15 min. The maximum is only about 3% of Zone 3’s peak concentration.
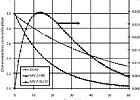
FIGURE 8. Transient concentration response to a release in Zone 3 with 80% VAV filter efficiency.
Conclusions
For exterior releases near the OA intake, DOAS filter efficiencies must be higher than that of a VAV system to achieve either equal concentrations after 1 hr, or equal exposure. This may at first seem a DOAS penalty, however with the much lower flow rate, the filter face area for equivalent face velocity is very low. Any concern about the ability of the DOAS to flush the facility can be overcome by selection of the proper filter efficiency.When a contaminant is released in a zone, large low-airflow spaces served by a VAV system clear slowly, similar to DOAS. And VAV systems do spread the contaminant to the entire facility they serve. That spread is smaller in magnitude if the contaminant is released into a small zone, or if the filtration efficiency is high. Initially, both DOAS and VAV experience the full impact of the release.
DOAS fares well with exterior releases if proper filters have been selected. And it retains the advantage over VAV for internal releases of not recirculating contaminants. However, the flush time for DOAS is greater than VAV in most filtered cases in the target zone.
This introductory investigation is intended to help provide a framework for thinking about the issue of safety. Many other facility arrangements, boundary conditions, release characteristics, etc., are possible. This short article is by no means intended to be exhaustive.
