A recent ASHRAE research project, RP 1137, indicated that the calibration of individual VAV terminals was often the most significant improvement made during recommissioning.1During the course of RP 1137, several VAV terminals were located downstream of "poor" duct conditions and questions were developed regarding the response of VAV airflow sensors. Designers are often compelled to use transitions prior to VAV terminals due to constricted ceiling spaces; however, ductwork is often installed with poor geometry contrary to the design intent.
Unfortunately, there is a common misconception that the effects of transitions are minimized if a long straight section of ducting is located prior to the VAV terminal.
This study sought to experimentally determine the effects of poor upstream duct geometry on the response provided by different VAV airflow sensors, from a recommissioning point of view. Several non-ideal duct configurations were recreated in a laboratory based on the upstream conditions commonly found in real buildings.
Two brands of VAV terminals were obtained in 10-, 8-, and 6-in. diameter sizes. Manufacturer's recommended airflow rate and static pressure were obtained using a variable-speed centrifugal fan. The true airflow measurements (QTRUE) were made using ANSI/ASHRAE 41.2-1987 recommendations. The dif-ference between the indicated flow rate from the VAV terminal (QVAV) and the true flow rate (QTRUE) was represented in the analysis with a dimensionless coefficient (C), defined in the following equation.
C= (QVAV) / (QTRUE)
Where:
QVAV = the airflow rate indicated by the VAV sensor (m3/s)
QTRUE = the true airflow rate (m3/s)
C = sensor amplification, a convenient flow constant (dimensionless)
The laboratory experiments focused on determining this flow amplification coefficient (C) for a number of known upstream duct geometries. Readings were taken at five different VAV damper positions: fully open (90°), partially closed (70°), half closed (45°), partially open (20°), and fully closed (0°). Several duct configurations were constructed over the course of these experiments, including an ideal duct section with at least 40D of straight duct prior to the VAV terminal. The ideal case was used to determine the baseline response for each VAV terminal.
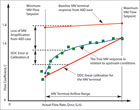
In the determination of the coefficient, C, the data was only considered within the airflow range recommended by the manufacturers. The apparent loss of amplification, shown in Figure 1, is certainly not desirable; however, the greater concern is the error associated with the flow sensors when compared to the DDC system calibration.
The linear calibration was obtained using maximum and minimum flow setpoints for the individual VAV box. Although this two-point type of calibration is certainly not desirable (Figure 1 shows a clear error is incurred), it is, unfortunately, quite a common practice during recommissioning. It is also quite common to take a single point at the maximum of the VAV range and simply assume a zero reading, which can result in even greater calibration errors.
Discussion Of Results
The results indicate the average change in VAV airflow sensor amplification in relation to the standard (or 40D baseline) response. Likewise, VAV sensor precision was determined from the standard deviation of the test cases compared to the baseline scatter. Key geometries included: two 90° elbows in series, S-shaped bends (two 45° elbows in series), concentric reducers or expanders, and concentric reducers or expanders with 90° elbows.Sample results are presented for the concentric reducer trials, which indicated the most dramatic loss of signal amplification and precision. In contrast, the use of concentric expanders had a very minor effect on amplification but produced a high degree of imprecision.
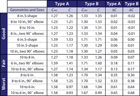
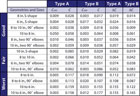
Tables 1 and 2 summarize the results of the study in terms of loss of accuracy and precision. Since the coefficient C is really the ratio of the apparent flow to the true flow, it is apparent from Table 1 that the duct configurations created usually result in the control system under predicting the flow rate. This, in turn, results in an increase in fan speed or damper opening with a corresponding increase in power and operational cost.
Flow Visualization
Smoke wire visualization was used to identify how the wake region (located around the static pressure port, behind the VAV airflow sensor) changed in relation to the upstream geometry and damper position. The average upstream air speed was maintained at 4.5 m/s, and the damper was rotated from fully open (90°), half closed (45°), and nearly closed (30°) for each duct geometry. Only the Type B VAV sensors were evaluated using flow visualization, and the results are presented in Figure 2.Previous results indicated that VAV airflow sensors lose significant amplification at the lower end. It was hypothesized that the loss in amplification was related to the wake region. Flow visualization also indicated that the placement of the damper affects the amplification of the airflow sensor. Three duct geometries were considered using flow visualization: a straight duct (another baseline test), a concentric reducer (which resulted in the greatest loss of amplification), and a 90° elbow.
The results of the flow visualization experiments led to a few useful conclusions regarding VAV airflow sensor response. The position and size of the wake region changes in response to the upstream geometry. In the case of the 90° elbows, this change was quite dramatic.
Discussion of Duct Length Prior to the Sensor
Despite differing results that were encountered with the various flow obstructions (elbows, reducers, etc.), it was evident that the accuracy and precision were independent of adequate duct lengths in nearly every test.In each case, there was very little difference between the results for the 10D test and the 2D test, which directly contradicts common industry practices. The HVAC industry generally believes (with some justification) that after 10D of straight unobstructed duct, an accurate reading can be taken. This belief likely follows the pro-cedure for completing a pitot tube traverse, where 7.5D of straight duct prior and 3D afterward is considered adequate. Unfortunately, the results of the laboratory experiments indicate that 10D is insufficient to improve the response of VAV airflow sensors and that adequate duct length is not nearly as significant as the type of obstruction.
Further tests would be required to determine exactly what would constitute an adequate duct length prior to a VAV airflow sensor to minimize the scatter and maximize the amplification.
It is also expected that the adequate duct length should be dependent on the volume flow rate (Q), where the required duct length for a uniform turbulent velocity profile will increase with the velocity. This relationship could be estimated from a fluid mechanics standpoint; however, since the ideal case utilized only 40D of unobstructed duct (and responded with excellent amplification and precision) it can be concluded that the adequate duct length lies between 10D and 40D for the range of flow rates considered here.
Conclusions
The improvement of VAV airflow sensor response can provide large benefits within an HVAC system, includ-ing increased energy savings and system accuracy. The calibration of VAV airflow sensors is also essential when completing an effective recommissioning procedure. The improvement of flow sensor accuracy is a goal that can be approached from the viewpoint of the HVAC system designer, the manufacturer, or the recommissioning agent. This study has provided suggestions for each of these roles.
HVAC System Designers
- Designers are often forced to place non-ideal duct geometry prior to a VAV terminal due to space con-straints. However, minimizing the use of obstructions and transitions prior to VAV terminals is the most obvi-ous way to improve system accuracy. The experiments indicated that placing concentric reducers prior to a VAV terminal resulted in the worst airflow response (that was tested). From a recommissioning standpoint, it is unimportant that we lose amplification with non-ideal upstream conditions (although the loss of sensor amplification in itself is certainly never desirable) because we can adjust for that with calibration. However, it is significant that the amplification varies with flow rate, sometimes significantly, and that cannot be fixed with a simple calibration.
- Designers should take care to specify medium velocity duct branches to match the diameter of VAV terminal boxes to avoid the inaccuracy associated with concentric reducers. Boxes that are supplied with these reducers from the factory to meet specified sizes should not be permitted. This is particularly important in applica-tions where accurate flow is critical to system performance, such as hospital isolation rooms or containment laboratories.
- Whenever possible, the VAV terminals should be selected such that they do not operate close to the minimum flow range where flow accuracy is poor. Experimentation has shown that VAV terminals are more prone to flow errors at (or close to) the minimum flow setpoint. Designers should specify the smallest VAV terminal they can which will provide the maximum required cfm to the space. Situations requiring very large variations in flow should be serviced using multiple VAV boxes.
- It was also shown that providing 10D of unobstructed duct prior to a VAV terminal does not compensate for transitions placed upstream, which is a common misconception when designing these types of systems. The true "adequate" value will vary with the flow rate, but is likely between 10D and 40D. Further testing is required, but assuming that 10D of straight ducting will counter the effects of upstream transitions will result in flow errors. HVAC designers should remain aware that not all VAV terminals are created equal. Until enforceable standards are introduced to regulate the accuracy and precision of VAV airflow sensors, the onus is on designers to ensure that they choose the best terminals available. This will be difficult, initially, until an independ-ent standard test method can be developed to evaluate these sensors.
VAV Manufacturers
- Current VAV terminal designs position the flow sensor 2D (or less) upstream from the damper. It is expected that increasing this distance will decrease the likelihood of flow errors that result from highly non-uniform velocity profiles.
- Current practice by some manufacturers to provide for particular box sizes by installing concentric reducers on box inlets should be discontinued. Some VAV manufacturers will install concentric reducers on the same-sized VAV terminals to provide a greater range of useful terminal sizes. These experiments have shown that placing concentric reducers immediately prior to the VAV terminals will result in a high degree of amplification loss, and non-uniformity that will result in DDC system inaccuracy and energy inefficiency.
- The current circular damper design, while simple and inexpensive, lowers both the operational range and the accuracy/precision associated with the sensor. Alternate designs, which ideally would produce a symmetric damper opening, should improve flow sensor response.
- Current VAV terminals also typically take the static pressure measurements from a single location in the wake of the sensor. This is presumably done to provide an amplified flow differential signal. Unfortunately, this amplification is highly non-uniform and with the addition of poor upstream geometry, this greatly reduces the accuracy of the sensor. VAV manufacturers are (of course) motivated to develop the best airflow sensor in terms of accuracy, precision, and uniformity. However, the driving consideration in this industry is to remain cost effective. There are several ways to improve on VAV airflow sensor design while remaining cost effective, but it is the authors' opinion that providing a more expensive (and presumably, much better) airflow sensor is a desirable goal.
Commissioning Agents
Agents are usually forced to deal with non-ideal duct configurations and poor flow sensor design on a daily basis. Fortunately, agents can take steps to minimize the error associated with these factors, and even adjust for extremely poor upstream conditions. The following suggestions target very common mistakes.
- The most obvious solution is to complete the full ASHRAE recommended traverse in non-ideal locations. This practice will not completely compensate for poor flow sensor design but it will also not compound the error associated with the VAV terminal.
- Agents should avoid balancing VAV terminals at only the minimum and maximum flow setpoints. They should also avoid measuring only the maximum setpoint and using an assumed zero value, which is much worse in most cases. It was shown that the loss of sensor amplification following poor geometry often results in a nonlinear sensor response.
- It was shown that balancing at the minimum flow setpoint has a much higher likelihood of being inaccurate (in general) due to the nature of these flow sensors. If possible, it is always better to balance the VAV terminal at a few flow rates between 25% and 100% of the maximum setpoint if they are located very close to duct transitions. This will decrease the errors in the flow signal, thus improving the response of the flow sensor array. At a bare minimum, three points should be used throughout the VAV terminal range, if possible. Unfortunately, some VAV terminals allow for only a single point calibration, which we have shown to be inadequate for almost all of the upstream conditions tested here. In these situations, accuracy will obviously be compromised.
However, if the calibration point can be taken at the most common operations point of the VAV terminal range, this error can be slightly minimized. Barring access to trend data where the variations in airflow are known and an average value can be used, a value that is 70% of the maximum flow setpoint is the most common design value.
AUTHOR BIO:
Ackerman is a faculty service officer in the department of mechanical engineering at the University of Alberta, Edmonton, AB, Canada. He teaches undergraduate courses in measurement and design, and has been involved in building science research since 1979. His research interests include air infiltration measurements, passive solar heating, and general energy conservation, and he also does work with protective clothing and flash fires, and has developed the only facility in Canada capable of testing fire protective clothing. E-mail him at Mark Ackerman P.E..Klaczek completed his master's degree in mechanical engineering at the University of Alberta in 2004.His thesis focused on recomissioning VAV systems with DDC. He is as a research engineer with C-FER Technologies of Edmonton, AB, Canada, where he continues to work in the area of fluid dynamics. E-mail him at Wayne Klac-zek.
END NOTES
1. Klaczek, W., M.Y. Ackerman, P. Fleming, B.A. Fleck, "Field performance assessment of VAV control systems to determine the longevity of re-commissioning: RP 1137,"ASHRAE Transactions, January 2006.
