
2001 Cooling Season Summary
As the cooling season is over for most of the country, this is a good opportunity to summarize how the year 2001 measured up to the cooling and wet bulb design conditions defined in the 1997ASHRAE Fundamentals Handbook. Just to review - the cooling and wet bulb design values are used for the design and sizing of ventilation, cooling, dehumidification, and condenser water systems and equipment. The design values represent the value that is exceeded on average by the indicated percentage of the total number of hours in a year (8,760). In other words, the 0.4%, 1.0%, and 2.0% values are exceeded 35-, 88-, and 175-hrs per year respectively. The mean coincident wet bulb and dry bulb values are the average values that occur with the corresponding design dry and wet bulb values.This report provides the number of hours that meet or exceed the ASHRAE design cooling dry bulb and wet bulb temperatures. Note that the data represents year to date values from January through the data month (September in this case). In previous issues, only monthly values were given.
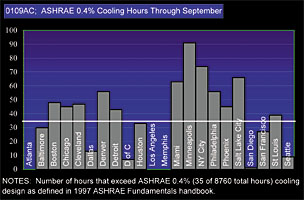
The cooling design hours in the table and Figure 0109AC show that the major Southern and Western cities experienced fewer cooling design hours than normal. In fact, the 0.4% cooling design condition was never reached in Atlanta, Los Angeles, or Memphis. On the other hand, the dry bulb cooling design hours were exceeded in most of the major cities in the Northern and Central regions. Minneapolis experienced 182-hrs above 91?. That's 5.2 times the 0.4% design of 35-hrs. Just for fun, the average cooling design hours for the 22 cities listed were 36, 88, and 185 compared to the 35-, 88-, and 175-design hrs for the three design conditions - pretty close to an average year, countrywide.
The wet bulb design hours and figure 0109AWB indicate that the outdoor air humidity was much higher than normal across most of the country with the exception of the West coast. As a result, cooling tower water consumption was higher than normal. Also, higher outdoor air ventilation cooling energy consumption likely had a noticeable impact on utility bills.
Calculating Outdoor Air Ventilation Cooling Loads
Many hvac engineers assume that the cooling design dry bulb temperature and mean coincident wet bulb temperature should be used to calculate ventilation loads. In fact, most load software programs default to these values. This assumption could have serious consequences, especially in humid climates. According to the Fundamentals handbook, design conditions based on wet bulb temperature represent extremes of the total sensible plus latent heat of outdoor air. The design wet bulb and mean coincident dry bulb temperature should always be used for outdoor air ventilation load calculations in humid climates.There is truth in numbers. Take Houston for example. The enthalpy associated with the 0.4% design wet bulb and mean coincident dry bulb temperature of 80?/90? is 43.7 Btu/lb. There were 14 hours where the enthalpy exceeded this value in year 2001, which is below the 0.4% value of 35-hrs. However, the enthalpy associated with the design dry bulb and mean coincident wet bulb temperature of 96?/77? is 40.4 Btu/lb. There were 755-hrs when the enthalpy of the outdoor air exceeded this value.
As a result, if the design dry bulb temperature was used to size the cooling plant for a building in Houston with high ventilation requirements, it is possible that the system would be pushed to its limits for many more hours than expected. ES
EDITOR'S NOTE: Some of the images associated with this article do not transfer effectively to this website and as a result are not included here. Please reference the print version of the November 2001 issue of Engineered Systems to view the images.
