
Evaluating Last Year's Ventilation Costs
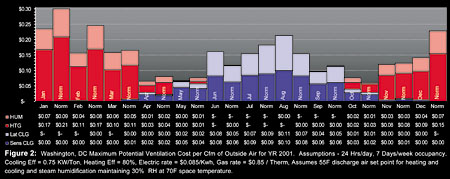
Now that 2001 is behind us, we can look back and analyze how the weather impacted utility costs and how the year measured up to design conditions. For example, let's evaluate the 2001 outdoor air ventilation energy costs for Washington, DC. The first step is to convert the data to common units (Btu's) or dollars. This will allow us to graph them together and show how each component contributed to the total cost. I like using dollars because they have more significance to more people. For heating: $?cfm = (Therms?cfm x $?Therm) ? (%eff). For cooling: $?cfm = (ton-hr?cfm x kW?ton eff x ($?kWh). And for steam humidification: $?cfm = (gals?cfm x 8.35 lbs?gal x 1,150 Btu/lb x $/Therm) ? (100,000 Btu/Therm x %eff).Figure 2 (opposite) shows the 2001 Washington outdoor air ventilation utility costs per cfm compared to normal. From this graph we can see the cost impact that the weather had on ventilation utility costs each month. We can also compare the impact of each individual cost component (sensible cooling vs. latent cooling, etc). If the volume of outside air being conditioned is significant, the results should coincide with data from the utility bills. If the weather and utility data do not agree, then a flag should go up to investigate why not. In addition to normal data, similar comparisons can be made to weather and utility data from previous years.
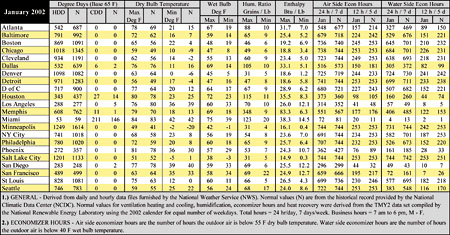
Figure 3 summarizes the total annual ventilation costs for a 250,000-cfm constant volume lab building in Washington. The table shows that the overall net cost reduction for the year was 11%, or $51,004. However, recall that this reduction only represents the impact of weather on ventilation costs. Other factors affected by weather also come in to play such as heat recovery, building envelope heating and cooling, economizer cooling, cooling tower and humidifier water consumption, etc. These will be discussed further in upcoming columns.

Data Requests
I have received numerous requests for data (text files) for use in spreadsheet programs. I would be happy to share some of these files with anyone who is interested. Just send me an e-mail identifying what you need and I'll try to help you out.ESEDITOR'S NOTE: Some of the images associated with this article do not effectively translate to thie website. Please refer to the print version of ES to view these images.
