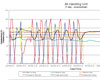
Figure 1. An example of a trend log graphic.
How to spot performance problems hidden beneath the surface?
On-site functional performance testing (FPT) of systems at the end of construction is the culmination of the commissioning process. FPT should put each system through its paces, confirming that the system performs as designed and that it meets the owner’s requirements under all modes of operation. This often entails overriding the systems to simulate conditions other than those under which the tests are actually performed.
This testing is a onetime snapshot of a system’s operation and, due to time and budget constraints, each step of a test is typically pass/fail in nature. For example, does a valve open? Does a damper close? Does the temperature setpoint increase? In order to expedite the testing process, control parameters such as setpoints and/or actual temperature, pressure, or humidity inputs are overridden drastically so that the required reaction can be observed without a lot of waiting.
Most building systems do not experience drastic changes in load conditions during normal operations. Therefore, the FPT process does not allow observation of the systems under normal operating conditions and load fluctuations. The use of trend logs to validate extended operation of some or all of the systems is a valuable process to supplement field functional testing.
Shining a light on potential problems
Using the BAS, or portable dataloggers if there is no trend-capable BAS, to monitor and record control input and output points over the course of a few days or a couple weeks can bring to light operational issues that are less likely to be found during field functional testing. This is partly because of the expedited nature of the FPT procedures and partly because the testing team cannot reasonably be expected to observe and record all data simultaneously under each tested mode of operation.A simple example of this is in this trend log of selected control points for an AHU (Figure 1). This is one day’s worth of data that clearly shows the difference between day (unit on) and night (unit off). It also shows a constant 65°F discharge air temperature setpoint (purple) and a steady mixed air temperature of 60° (orange). The outside air temperature (green) is lower than the mixed air temperature, so this demonstrates that the economizer dampers (yellow) were functioning well to maintain their setpoint mixed air temperature.
The discharge air temperature (black), however, fluctuates between 55° and 75° while the chilled water valve (blue) and hot water valve (red) hunt dramatically throughout the day. The cycle of the fluctuations was fast enough that it was not noticeably affecting the spaces served, as illustrated by the steady return air temperature (brown).
This condition may have gone unnoticed without the trend analysis, because the space condition requirements were achieved and the valves and dampers were opening and closing as needed. The fact that the chilled water and hot water valve control programming was resulting in unnecessary overcooling and overheating was a problem because it was wasting energy (to the tune of more than $40,000/yr for this large air handler).ES


